By George Liu and Matthew Turk

In part one of this quant research piece, we introduce the decentralized finance (DeFi) collateralized lending platform known as Compound Finance and discuss its use case for stablecoins, in comparison to the notion of a “risk-free” interest rate from traditional finance (TradFi). Our goal is to tie these concepts together to educate on how different types of low-risk investment work within the TradFi and crypto markets.
This introduction examines stablecoin lending yield and shares insights on yield performance, volatility, and the factors driving lending yield. Part two of this piece will examine the factors that drive lending yield in more detail.
What are Stablecoins?
Stablecoins are a niche part of the ever-growing crypto ecosystem, primarily used by crypto investors as a practical and cost-efficient way to transact in cryptocurrency. The invention of stablecoins in the crypto ecosystem is brilliant because of the following properties:
- Similar to the fiat currencies used in model economies, stablecoins provide stability in price for people transacting across digital currencies or between fiat and digital currencies.
- Stablecoins are native crypto tokens that can be transacted on-chain in a decentralized manner without involvement of any central agency.
With the growing adoption of cryptocurrencies by investors from the TradFi world, stablecoins have become a natural exchange medium between the traditional and crypto financial worlds.
Risk-Free Interest Rate
Two of the shared core concepts in the traditional and crypto financial worlds are the concepts of risk and return. Expectedly, investors are likely to demand higher return for higher risk. During the current Russia-Ukraine war, the Russian interest rate increased from an average of approximately 9% to 20% in 2 weeks, which is a clear indication of how the financial market reacts to risk.
Central to the framework of risk and return is the notion of a “risk-free” rate. In TradFi, this rate serves as a baseline in judging all investment opportunities, as it gives the rate of return of a zero-risk investment over a period of time. In other words, an investor generally considers this baseline rate as a minimum rate of return he or she expects for any investment, because rational investors would not take on additional risk for a return lower than the “risk-free” rate.
One example of a “risk-free” asset is the U.S. Treasury debt asset (treasury bonds, bills, and notes), which is a financial instrument issued by the U.S. government. When you buy one of these instruments, you are lending the U.S. government your money to fund its debt and pay the ongoing expenses. These investments are considered “risk-free” because their payments are guaranteed by the U.S. government, and the chance of default is extremely low.
A “risk-free” rate is always associated with a corresponding period/maturity. In the example above, treasury debt assets could have different maturities, and the corresponding risk-free rate (also called treasury yield) are different as well.
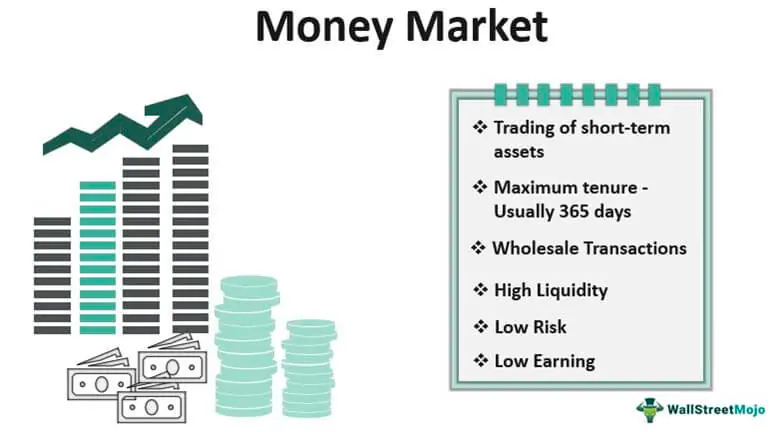
The duration could be as short as one day, in which case we call it overnight risk-free rate or general collateral rate. This rate is associated with the overnight loan in the money market and its value is decided by the supply and demand in this market. The loans are typically collateralized by highly rated assets like treasury debt, and are thus deemed risk-free as well.

Source: WallStreetMojo
Compound V2 and Stablecoin Lending Yield
With the growth in acceptance of crypto assets and the corresponding market globally, crypto based investing has become a popular topic for people who have been previously exposed only to the traditional financial market. When entering into a new financial market like this, the first thing these investors generally observe is the risk-free rate, as it will be used as the anchor point for evaluating all other investment opportunities.
There is no concept of treasury debt in the crypto world, and as such, the “low-risk” (rather than risk-free) interest rate is achieved in DeFi collateralized lending platforms such as Compound Finance. We use the term “low-risk” here, because Compound Finance, along with many other DeFi collateralized lending platforms, are not risk-free, but rather subject to certain risks such as smart contract risk and liquidation risk. In the case of liquidity risk, a user who has negative account liquidity is subject to liquidation by other users of the protocol to return his/her account liquidity back to positive (i.e. above the collateral requirement). When a liquidation occurs, a liquidator may repay some or all of an outstanding loan on behalf of a borrower and in return receive a discounted amount of collateral held by the borrower; this discount is defined as the liquidation incentive. To summarize risk in DeFi, the closest we can get to risk-free is low-risk.

To clarify, for the sake of this post (and part two), we are looking into Compound V2. On Compound, users interact with smart contracts to borrow and lend assets on the platform. As shown in the example diagram above:
- Lenders first supply stablecoins (or other supported assets) such as DAI to liquidity pools on Compound. Contributions of the same coin form a large pool of liquidity (a “market”) that is available for other users to borrow.
- The borrower can borrow stablecoins (take a loan) from the pool by providing other valuable coins like ETH as collateral in the above diagram. The loans are over-collateralized to protect the lenders such that for each $1 of the ETH used as the collateral, only a portion of it (say 75 cents) can be borrowed in stablecoins.
- Lenders are issued cTokens to represent their corresponding contributions in the liquidity pool.
- Borrowers are also issued cTokens for their collateral deposits, because these deposits will form their own liquidity pools for other users to borrow as well.
How much interest a borrower needs to pay on their loans, and how much interest a lender can receive in return, is determined by the protocol formulas (based on supply/demand). It is not the intention of this blog to give a comprehensive introduction to the Compound protocol and the many formulas involved (interested parties please refer to the whitepaper for an in-depth education). Rather, we would like to focus on the yield that an investor can generate by providing liquidity to the pool, which will facilitate our yield comparison between the two financial worlds.
A Compound user receives cTokens in exchange for providing liquidity to the lending pool. While the amount of cTokens he holds stays the same through the process, the exchange rate that each unit of cToken can be redeemed with to get the fund back keeps going up. The more loans are taken out of the pool, the more interest rate will be paid by the borrowers, and the quicker the exchange rate will go up. So in this sense, the exchange rate is an indication of the value of the asset that a lender has invested over time, and the return from time T1 to T2 can be simply obtained as
R(T1,T2)=exchangeRate(T2)/exchangeRate(T1)-1.
Additionally, annualized yield for this investment (assuming continuous compounding) can be calculated as
Y(T1,T2)=log(exchangeRate(T2)) — log(exchangeRate(T1))/(T2-T1)
USDT/USDC Lending Yield Analysis
While the Compound pools support many stablecoin assets such USDT, USDC, DAI, FEI etc, we are only going to analyze the yields on collateralized lending for the top 2 stablecoins by market cap, i.e. USDT and USDC, with market capitalizations of $80B and $53B respectively. Together, they make up over 70% of the total market for stablecoins.
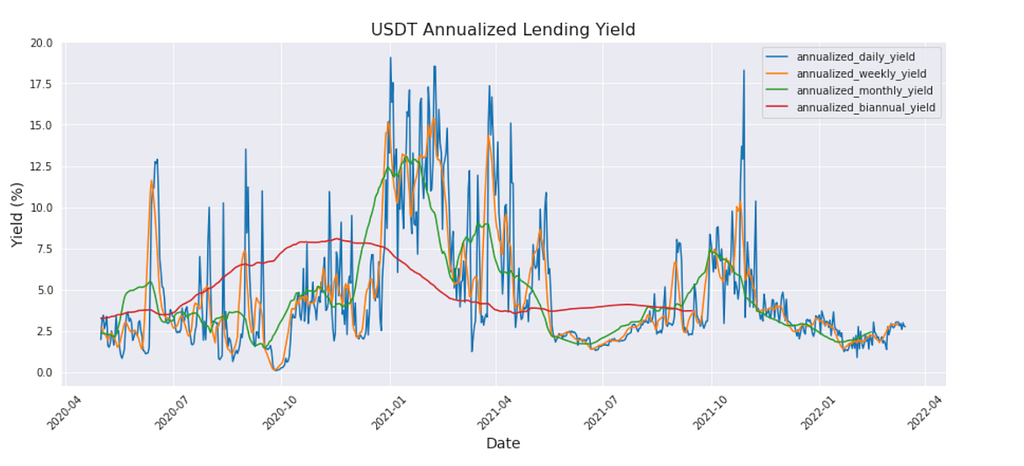
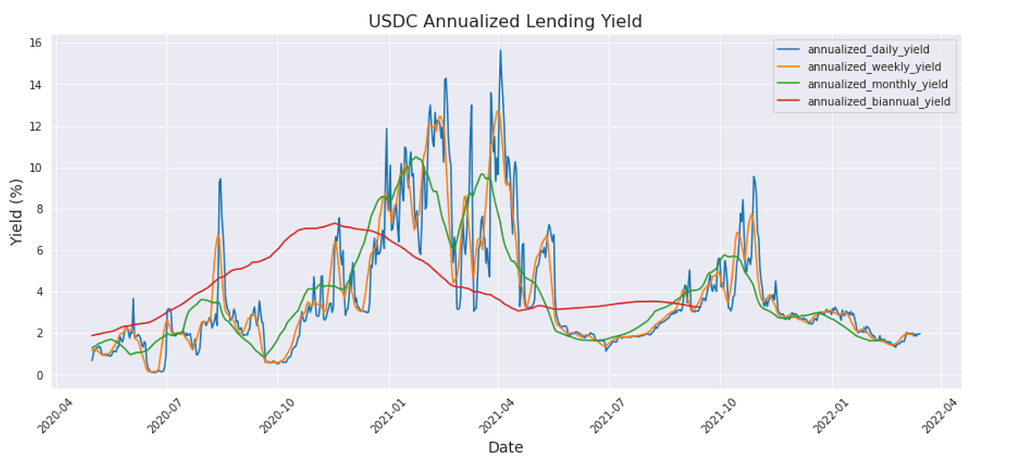
Here below are the plots of the annualized daily, weekly, monthly, and biannual yields generated according to the formulas in the previous section. As one can see, the daily yield is pretty volatile, while the weekly, monthly, and biannual yields are respectively the smoothed version of the prior granular plot. USDT and USDC have pretty similar patterns in the plot, as lending of both of these assets experienced high yield and high volatility for the start of 2021. This indicates there are some systematic factors there that are affecting the DeFi lending market as a whole.


Source: The Graph
One hypothesis of the systemic factors that could affect the lending yield involves crypto market data such as BTC/ETH prices and their corresponding volatilities. To illustrate an example (higher risk in this case), when BTC and ETH are in an ascending trend, it is believed that many bull-chasing investors will borrow from the stablecoin pools to buy BTC/ETH and then use the purchased BTC/ETH as collateral to borrow more stablecoins, and then repeat this cycle until the leverage is at a satisfying high level. This leverage effect helps the investors to magnify their returns as BTC/ETH keeps going up. We will explore this analysis more in part two of this blog post.
Future Directions
This blog has given a broadly applicable introduction to DeFi collateralized lending through the lens of Compound Finance and how it compares to “risk-free” rates from TradFi. As mentioned above, in part two of this blog post, we will further examine collateralized lending yields and share our insights on yield performance, volatility, and driving factors.
We, as part of the Data Science Quantitative Research team, aim to get a good holistic understanding of this space from a quantitative perspective that can be used to drive new Coinbase products. We are looking for people that are passionate in this effort, so if you are interested in Data Science and in particular Quantitative Research in crypto, come join us.
The analysis makes use of the Compound v2 subgraph made available through the Graph Protocol. Special thanks to Institutional Research Specialist, David Duong, for his contribution and feedback.
Part 1: Quantitative Crypto Insight: Stablecoins and Risk-Free Rate was originally published in The Coinbase Blog on Medium, where people are continuing the conversation by highlighting and responding to this story.
