Dogecoin hits 4-month lows vs. Bitcoin — 50% DOGE price rebound now in play

The prospects of Elon Musk abandoning Dogecoin would be dire for DOGE price in both Bitcoin and USD terms.
Dogecoin (DOGE) pared some losses versus Bitcoin (BTC) on March 10, a day after the DOGE/BTC pair fell to its lowest level since October 2022. Can DOGE price see an extended rebound ahead?
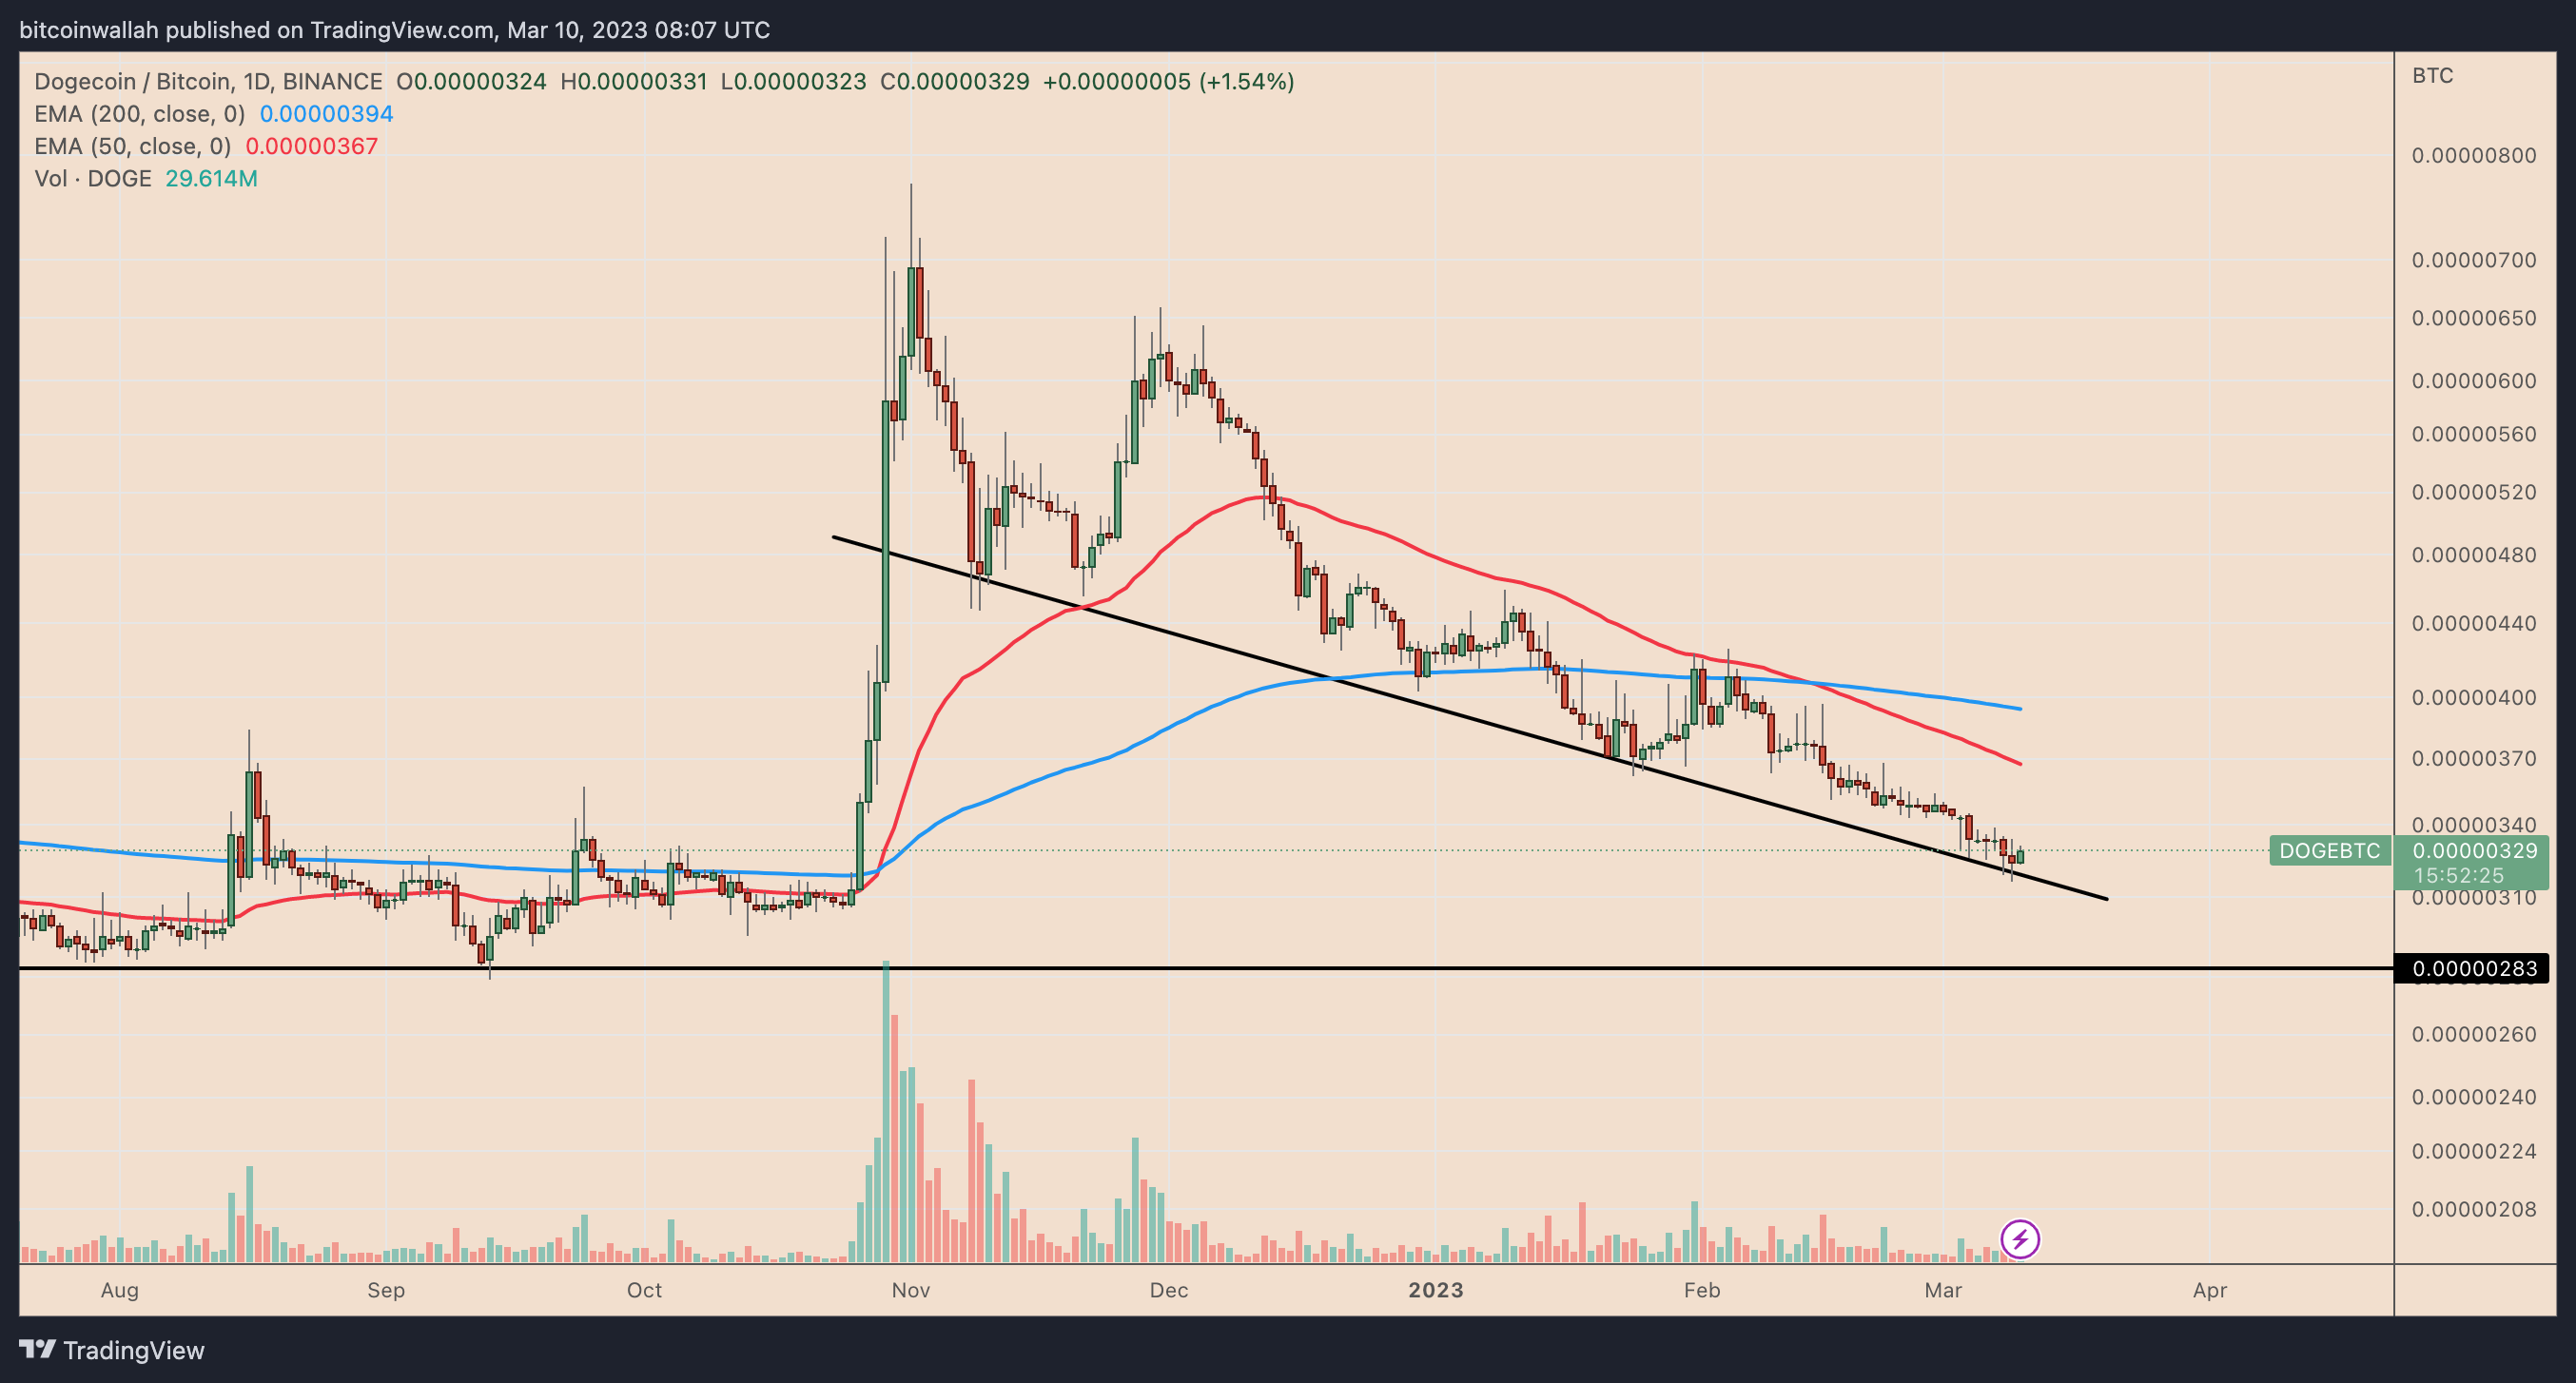
On the daily chart, the DOGE/BTC pair reached 331 sats, up 4.75% compared to the previous day’s low of 316 sats. The bounce occurred around a multi-month descending trendline, which has capped the pair’s downside moves since November 2022.

DOGE price vs. BTC
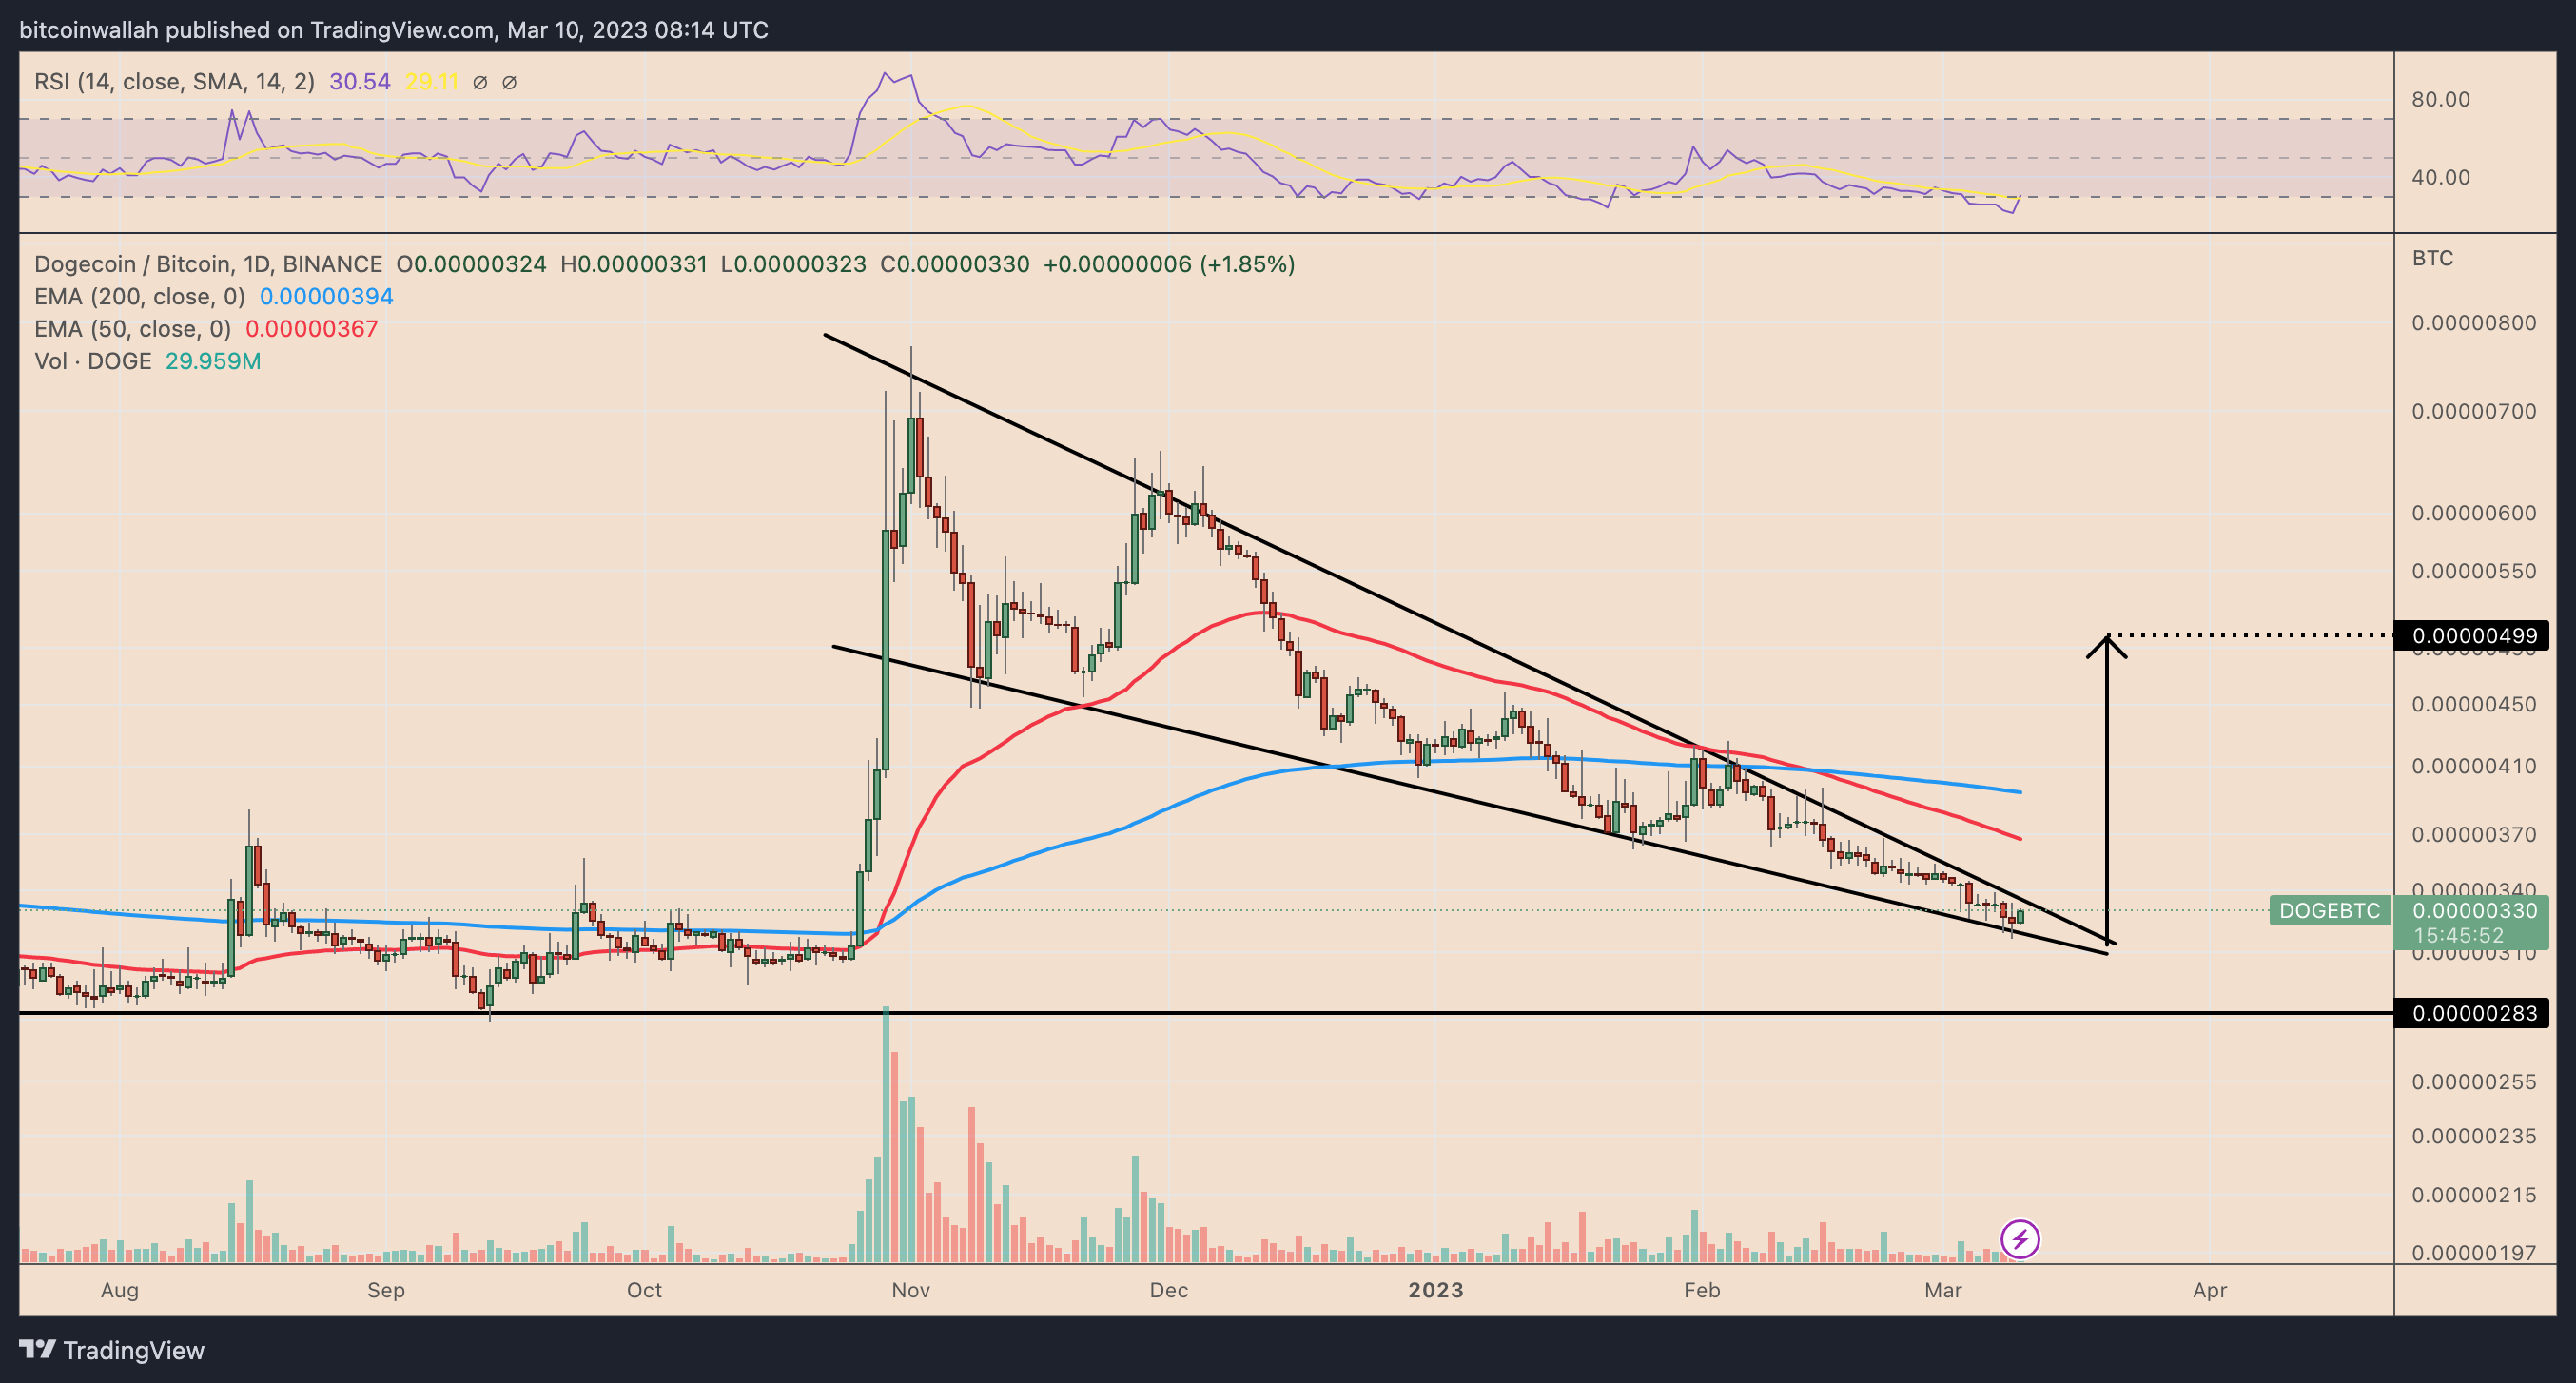
Interestingly, the DOGE/BTC descending trendline appears part of a prevailing falling wedge pattern. Traditional chart analysts consider the falling wedge a bullish reversal setup, notably because of the pattern’s 62% success rate in meeting its upside price targets.
In Dogecoin’s case, the price is wobbling around its falling wedge’s apex point, where its upper and lower trendline converge. DOGE’s latest rebound from the lower trendline increases its possibility of testing the upper trendline for a breakout, as illustrated in the chart below.

The upside setup further draws support from the DOGE/BTC’s daily relative strength index (RSI) with a reading of around 28. From a technical perspective, an RSI below 30 means the pair is oversold, which could prompt its price to consolidate sideways or rebound.
In the event of a breakout, DOGE/BTC can rise toward 500 sats by April, up 50% from current price levels. The upside target is measured after adding the maximum distance between the falling wedge’s upper and lower trendline to the breakout point.
A decisive drop below the falling wedge’s lower trendline, however, risks invalidating the whole upside setup. Instead, DOGE can drop toward 280 sats, a historical support level down, around 13% from current price levels
Such a scenario is possible given Dogecoin’s stint with a failed falling wedge pattern in March 2022, wherein the DOGE/USD pair broke below the lower trendline — 50% losses followed.
Which way for DOGE price?
Dogecoin could still fall in the U.S. dollar terms, however, largely due to increasing macroeconomic uncertainty.
In the past years, the Dogecoin price rallied primarily on the heels of news-driven events and Elon Musk’s support, including hopes of a DOGE payment option on Twitter.
Related: Why is the crypto market down today?
However, Musk said on March 3 that he would be shifting his focus from cryptocurrencies to artificial intelligence. The billionaire entrepreneur didn’t name Dogecoin specifically, but many interpreted that Musk may distance himself from the industry moving forward.
“I used to be in crypto, but now I got interested in AI”
— Elon Musk (@elonmusk) March 3, 2023
The price of Dogecoin has dropped by more than 20% to $0.06 since Musk’s tweet. Moreover, from a technical perspective, the price is well-positioned to drop by another 10% in the coming weeks in a retest of an old support level at around $0.055-0.042.

Conversely, a bounce from the support range could have DOGE’s price rally test the triangle’s upper trendline at around $0.076, resulting in gains of approximately 15% from current price levels.
This article does not contain investment advice or recommendations. Every investment and trading move involves risk, and readers should conduct their own research when making a decision.
Go to Source
Author: Yashu Gola


