1. Home
  2. Band Protocol

Band Protocol

End of bull run? The Graph awaits correction after a 200% GRT price rally

GRT has turned technically overbought, but its long-term potential remains skewed to the upside, thanks to healthy network fundamentals.

The Graph (GRT) price slipped on Feb. 8 alongside a broader correction across the top crypto assets.

GRT price skyrockets wi other data management tokens

GRT price plunged nearly 14.5% intraday to $0.18, showing signs of short-term upside exhaustion after rising over 200% earlier in the year. At its sessional high, the token was changing hands for $0.23 on Feb 7, its highest level in nine months

GRT/USD daily price chart. Source: TradingView

Buy flocked into the GRT market amid a relatively stronger risk-on mood, led by the Federal Reserve's slower interest rate hikes and a strong recovery witnessed in the Bitcoin (BTC) market, which typically influences altcoins into tailing the trend.

The GRT price rally also accompanied similar gains across data management platform tokens. This sector's market capitalization doubled so far in 2023, with Ocean Protocol (OCEAN), Mask Network (MASK), and Band Protocol (BAND) recording over 200%, 100%, and 60% gains, respectively.

Data management tokens and their performances. Source: Messari

Will The Graph's price correction continue?

The impressive GRT price rally has left The Graph as technically overbought, according to its daily relative strength index (RSI) indicator.

Notably, the daily RSI has exceeded 70, which traditional analysts consider an "overbought" signal. This typically leads to upside exhaustion, followed by consolidation or a significant price correction.

In either case, GRT's overbought status risks plunging its price by 30% in the next month to $0.13, a support level from the May-June 2022 consolidation session. The line also appears near the GRT/USD pair's 200-day exponential moving average (200-day EMA; the blue wave) near $0.11.

GRT/USD daily price chart. Source: TradingView

Nevertheless, from a fundamental perspective, GRT looks stronger due to its healthy network metrics.

For instance, The Graph recorded 66% quarter-over-quarter growth in its revenue from query fees in Q4 2022 due to the migration of subgraphs from its hosted service to the decentralized network (mainnet) in and after March 2022.

The Graph's revenue in recent quarters. Source: Messari

The Graph ecosystem involves two key players: on-chain API (or subgraph) developers and data consumers. Data consumers pay subgraph developers a fee to obtain data from blockchains, called query fees. This fee is paid in GRT tokens.

"Query fees should continue to increase as more subgraphs are migrated to mainnet in the coming quarters," noted Mihai Grigore, a researcher at Messari, in his quarterly report on the project, adding:

"This increase in volume may attract more key participants to the protocol as it drives profitability for existing ones."

Related: Blockchain indexer The Graph says adoption is still strong 2 years after mainnet launch

As a result, GRT's long-term bias could remain skewed toward the bulls. Moreover, independent analyst Altcoin Sherpa anticipates a strong bounce after The Graph token tests $0.13 as support.

GRT/USD daily price chart. Source: Altcoin Sherpa

"I'll just wait for a consolidation or dip and buy," he wrote, adding:

"You're going to look for stuff like this at .13 on lower TFs; some consolidation before another leg. Given how badly this one got rekt, I think it has more left in the tank. Insane volume."

This article does not contain investment advice or recommendations. Every investment and trading move involves risk, and readers should conduct their own research when making a decision.
MicroStrategy completes $3 billion convertible notes offering to buy more Bitcoin

Under-the-Radar Ethereum Oracle Project Skyrockets 146% in One Week As Bitcoin and Crypto Market Pop

Under-the-Radar Ethereum Oracle Project Skyrockets 146% in One Week As Bitcoin and Crypto Market Pop

A low-cap decentralized oracle crypto project is skyrocketing this week after it rolled out a major upgrade proposal. Band Protocol (BAND), a cross-chain data oracle platform, is trading at $2.88 at time of writing. The 230th-ranked crypto asset by market cap is up more than 5% in the past 24 hours and 146% in the […]

The post Under-the-Radar Ethereum Oracle Project Skyrockets 146% in One Week As Bitcoin and Crypto Market Pop appeared first on The Daily Hodl.

MicroStrategy completes $3 billion convertible notes offering to buy more Bitcoin

Crypto Whales Take Advantage of Dip, Swoop In on Ethereum (ETH) and Four Altcoins: Analytics Firm Santiment

Analytics firm Santiment is taking stock of the crypto markets as the world reacts to Russia’s ongoing war with Ukraine. In a new Insights blog post, the firm provides data that tracks the buying and selling action of more than 50 digital assets. Among the most accumulated altcoins were gaming tokens Enjin Coin (ENJ) and […]

The post Crypto Whales Take Advantage of Dip, Swoop In on Ethereum (ETH) and Four Altcoins: Analytics Firm Santiment appeared first on The Daily Hodl.

MicroStrategy completes $3 billion convertible notes offering to buy more Bitcoin

Whales Are Gobbling Up Three Crypto Assets – And Unloading Three Others, According to Insights Firm

Crypto whales are acquiring three altcoins at a rapid rate while unloading three others, according to Santiment. The crypto analytics firm notes that the number of addresses holding between 100,000 and 10 million Sushi (SUSHI) makes this group of whales owners of close to half of the asset’s total supply. SUSHI is the governance token […]

The post Whales Are Gobbling Up Three Crypto Assets – And Unloading Three Others, According to Insights Firm appeared first on The Daily Hodl.

MicroStrategy completes $3 billion convertible notes offering to buy more Bitcoin

Oracle tokens turn bullish as blockchain projects focus on interoperability

Oracle projects like LINK, BAND and TRB are seeing bullish momentum as crypto startups intensify their focus on interoperability in 2022.

2022 looks to be a transformative year for the cryptocurrency ecosystem as the focus on interoperability between siloed blockchain networks comes to the forefront and a multitude of projects announce plans to interconnect their platforms with other protocols. 

One sector of the crypto ecosystem that will play a vital role in ensuring smooth communication and interaction between networks is oracles projects like Chainlink (LINK) and Band Protocol (BAND).

Top 8 oracle projects by market capitalization. Source: Messari

Oracles relay data in a consistent, secure and decentralized manner and this is key to providing price feeds for the DeFi sector and centralized exchanges. 

The number of partners for the top oracle projects. Source: Twitter

As shown in the graphic above, Chainlink is by far the most widely adopted oracle in the crypto ecosystem with a near eight-fold lead in partners when compared to its nearest competitor Berry Data (BRY).

Chainlink secures new partnerships

A scroll through the Chainlink Twitter feed shows why LINK has started off 2022 as the top oracle provider by announcing multiple partnerships with DeFi and NFT projects.

The project has also benefited from its focus on developing the Cross-Chain Interoperability Protocol (CCIP) which helps facilitate the ongoing growth of the multi-chain ecosystem.

VORTECS™ data from Cointelegraph Markets Pro began to detect a bullish outlook for LINK on Dec. 10, prior to the recent price rise.

The VORTECS™ Score, exclusive to Cointelegraph, is an algorithmic comparison of historical and current market conditions derived from a combination of data points including market sentiment, trading volume, recent price movements and Twitter activity.

VORTECS™ Score (green) vs. LINK price. Source: Cointelegraph Markets Pro

As seen in the chart above, the VORTECS™ Score for LINK began to pick up on Dec. 10 and hit a high of 77, around 72 hours before the price increased 60% over the next three weeks.

Related: Blockchain enables enterprise business models in the Metaverse

Band Protocol launches on Celo

Band Protocol is a cross-chain data platform designed to help developers integrate real-world data into their decentralized applications including sports, weather, random numbers and price feed data.

The project recently announced that it had launched on Celo’s (CELO) mobile-first DeFi platform, which focuses on bringing decentralized finance to more than "6 billion smartphones in circulation." 

VORTECS™ data from Cointelegraph Markets Pro began to detect a bullish outlook for BAND on Dec. 29, prior to the recent price rise.

VORTECS™ Score (green) vs. BAND price. Source: Cointelegraph Markets Pro

As seen in the chart above, the VORTECS™ Score for BAND hit a high of 76 on Dec. 29, around 48 hours before the price began to increase 44% over the next five days.

With the major themes of interoperability and cross-chain integrations shaping up to be a primary focus of the cryptocurrency ecosystem in 2022, oracles are one sector of the market that could continue to see positive inflows thanks to their ability to transfer data and assets seamlessly and securely between supported blockchain networks.

The views and opinions expressed here are solely those of the author and do not necessarily reflect the views of Cointelegraph.com. Every investment and trading move involves risk, you should conduct your own research when making a decision.

MicroStrategy completes $3 billion convertible notes offering to buy more Bitcoin

Data shows traders rushed to buy altcoins during Bitcoin’s dip to $50K

Bitcoin price may be stuck in a rut but this hasn't stopped traders from loading up on LINK, BAND and Qtum.

Bitcoin’s (BTC) recent downturn temporarily pulled its dominance rate down to 49.5% which is the lowest level since August 2018. This has led a growing number of traders to predict that altcoins will outperform Bitcoin in the short term.

Over the past few months, the price action from altcoins seems to be disengaging from Bitcoin. Take for example, Ether (ETH), which hit a new all-time high today even as Bitcoin price is down 20% from its all-time high.

Crypto market data daily view. Source: Coin360

The major factor that could have tilted the scale in favor of altcoins is the massive rise in the popularity of the decentralized finance space. New York Stock Exchange president Thomas Farley pointed out in an interview with CNBC that “DeFi exchanges are doing as much volume if not more than Coinbase today.”

Let’s look at the fundamentals and technicals of three tokens that have been on the rise in the past few months.

LINK/USDT

Chainlink (LINK) is one of the most popular decentralized oracle solutions. To support the rapid pace of innovation in the crypto industry, Chainlink outlined its vision for the future in its new whitepaper dubbed Chainlink 2.0 on April 15.

The whitepaper presents a new architecture for building hybrid smart contracts where second-layer networks called Decentralized Oracle Networks store and compute the data off-chain before feeding the input on the blockchain. This new concept could empower developers to build hybrid smart contracts quickly, similar to application programming interfaces (APIs) that developers build in the web world.

Another positive for LINK investors came as Grayscale announced the addition of the altcoin to its Digital Large Cap Fund on April 6. Although the allocation is only 0.87%, the inclusion could bring it into the focus of institutional investors.

On April 2 Polkadot and Chainlink announced that Chainlink’s price feeds woul be available as Substrate oracle pallet, enabling projects in the Polkadot ecosystem to integrate Chainlink oracles through a simplified library.

LINK is currently correcting from its sharp rise from $23.61 on March 24 to the all-time high at $44.33 on April 15. Although the price plunged below the moving averages on April 18, the bulls aggressively bought at lower levels as seen from the long tail on the day’s candlestick.

LINK/USDT daily chart. Source: TradingView

Since then, the bears and the bulls have been battling it out at the 20-day exponential moving average ($35.89). The bulls are attempting to defend the 20-day EMA support and launch the next leg of the up-move while the bears are trying to extend the correction by breaking the support.

The marginally rising 20-day EMA and the relative strength index (RSI) above 57 indicate a minor advantage to the buyers. If the bulls can push and sustain the price above $40, the LINK/USDT pair could retest $44.33. A breakout of this resistance could start the next leg of the uptrend, which could reach $50 and then $55.72.

This bullish view will invalidate if the bears sink and sustain the price below the 20-day EMA. Such a move could pull the price down to the 50-day simple moving average ($31.42) and delay the start of the next leg of the uptrend.

BAND/USDT

Band Protocol (BAND) was featured by Cointelegraph on Feb. 2 when its price was at $11.14. Since then the price h rallied to an all-time high at $23.30 on April 15, a gain of 109% in about two and half months.

The protocol announced on April 15 that its oracle data is live on Google Cloud Public Data, which can be used to build traditional, hybrid blockchain and cloud applications. Band said that the integration into Google Cloud Public Data was the first among many use-cases being explored with partners “to bridge traditional enterprises and blockchain applications.”

Band has continued to build partnerships to increase its market share. In the past month, it has announced partnerships with Krystal, Equilibrium, and Polygon. Additionally, one of the biggest financial institutions in Thailand, SCB 10X partnered with Band as a node validator.

BAND is currently trading inside a large range between $11.50 and $20.62. The bulls had pushed the price above the overhead resistance of the range on April 15 and 16 but they could not build up on the breakout.

BAND/USDT daily chart. Source: TradingView

This suggests that bears are active at higher levels. The sellers pulled the price back into the range on April 17, trapping the aggressive bulls. Long liquidations could be one of the reasons for the sharp fall on April 18 that momentarily dropped below the $11.50 support.

However, the positive sign was that the bulls aggressively bought the dips on April 18 as seen from the long tail on the candlestick.

After staying between both moving averages for the past three days, the BAND/USDT pair has broken above the 20-day EMA ($17.04) today. The pair could once again move up to $20.62 where the bears are again likely to mount a stiff resistance.

The flat moving averages and the RSI just above the midpoint suggest that the range-bound action may continue for a few more days. A breakout and close above $21 could open the gates for the resumption of the uptrend. The next target on the upside could be $29.74.

QTUM/USDT

Qtum (QTUM) was covered by Cointelegraph on Feb. 11 when its price was at $7.59. The token took off and made an all-time high at $20.72 on April 19, rallying 173% in just over two months.

The most eagerly awaited development is the transition from 128-second block average to 32-second block average that is expected to take place via a hard fork on April 30.

On March 31 Qtum founder Patrick Dai said that the protocol was working to enable smart contracts for Filecoin through the Qtum network. On the same day, Dai teased that non-fungible tokens are also making their way on Qtum.

QTUM’s Doji candlestick pattern on April 19 indicated that the uptrend could be losing steam. The short-term weakness was confirmed further when the price continued lower on April 20.

QTUM/USDT daily chart. Source: TradingView

The bulls are currently attempting to defend the 20-day EMA ($15.08). A strong bounce off this support will indicate that the sentiment remains positive and the bulls are accumulating on dips.

The buyers will likely try to push the price to $18.63 and then $20.72. A breakout of this resistance will signal the resumption of the uptrend.

However, the negative divergence on the RSI suggests the momentum may be weakening. If the bears sink the price below the 20-day EMA, the QTUM/USDT pair could slump to the 50-day SMA ($10.47) where the buyers may step in to stall the decline.

A strong rebound off the 50-day SMA could keep the pair range-bound for a few days while a break below the support will suggest the bears are back in the game.

The views and opinions expressed here are solely those of the author and do not necessarily reflect the views of Cointelegraph. Every investment and trading move involves risk, you should conduct your own research when making a decision.

MicroStrategy completes $3 billion convertible notes offering to buy more Bitcoin

Oracle Tokens Chainlink, Band Protocol Enter New Bull Rally

Chainlink and Band Protocol have recently made new all-time highs. Though some investors may take advantage of the rising price action to book profits, these cryptocurrencies show no signs of slowing.

Chainlink Looks Unstoppable

Chainlink made headlines after releasing a new whitepaper that details how the project plans to execute “hybrid smart contracts.” The new architecture will expand the network’s utility by adding new services to the off-chain computation of data. 

“Hybrid smart contracts are about combining blockchain smart contract application capabilities, and the off-chain world’s proof and data and computations. This is a big leap forward because it redefines what people can build,” said Chainlink’s co-founder Sergey Nazarov.

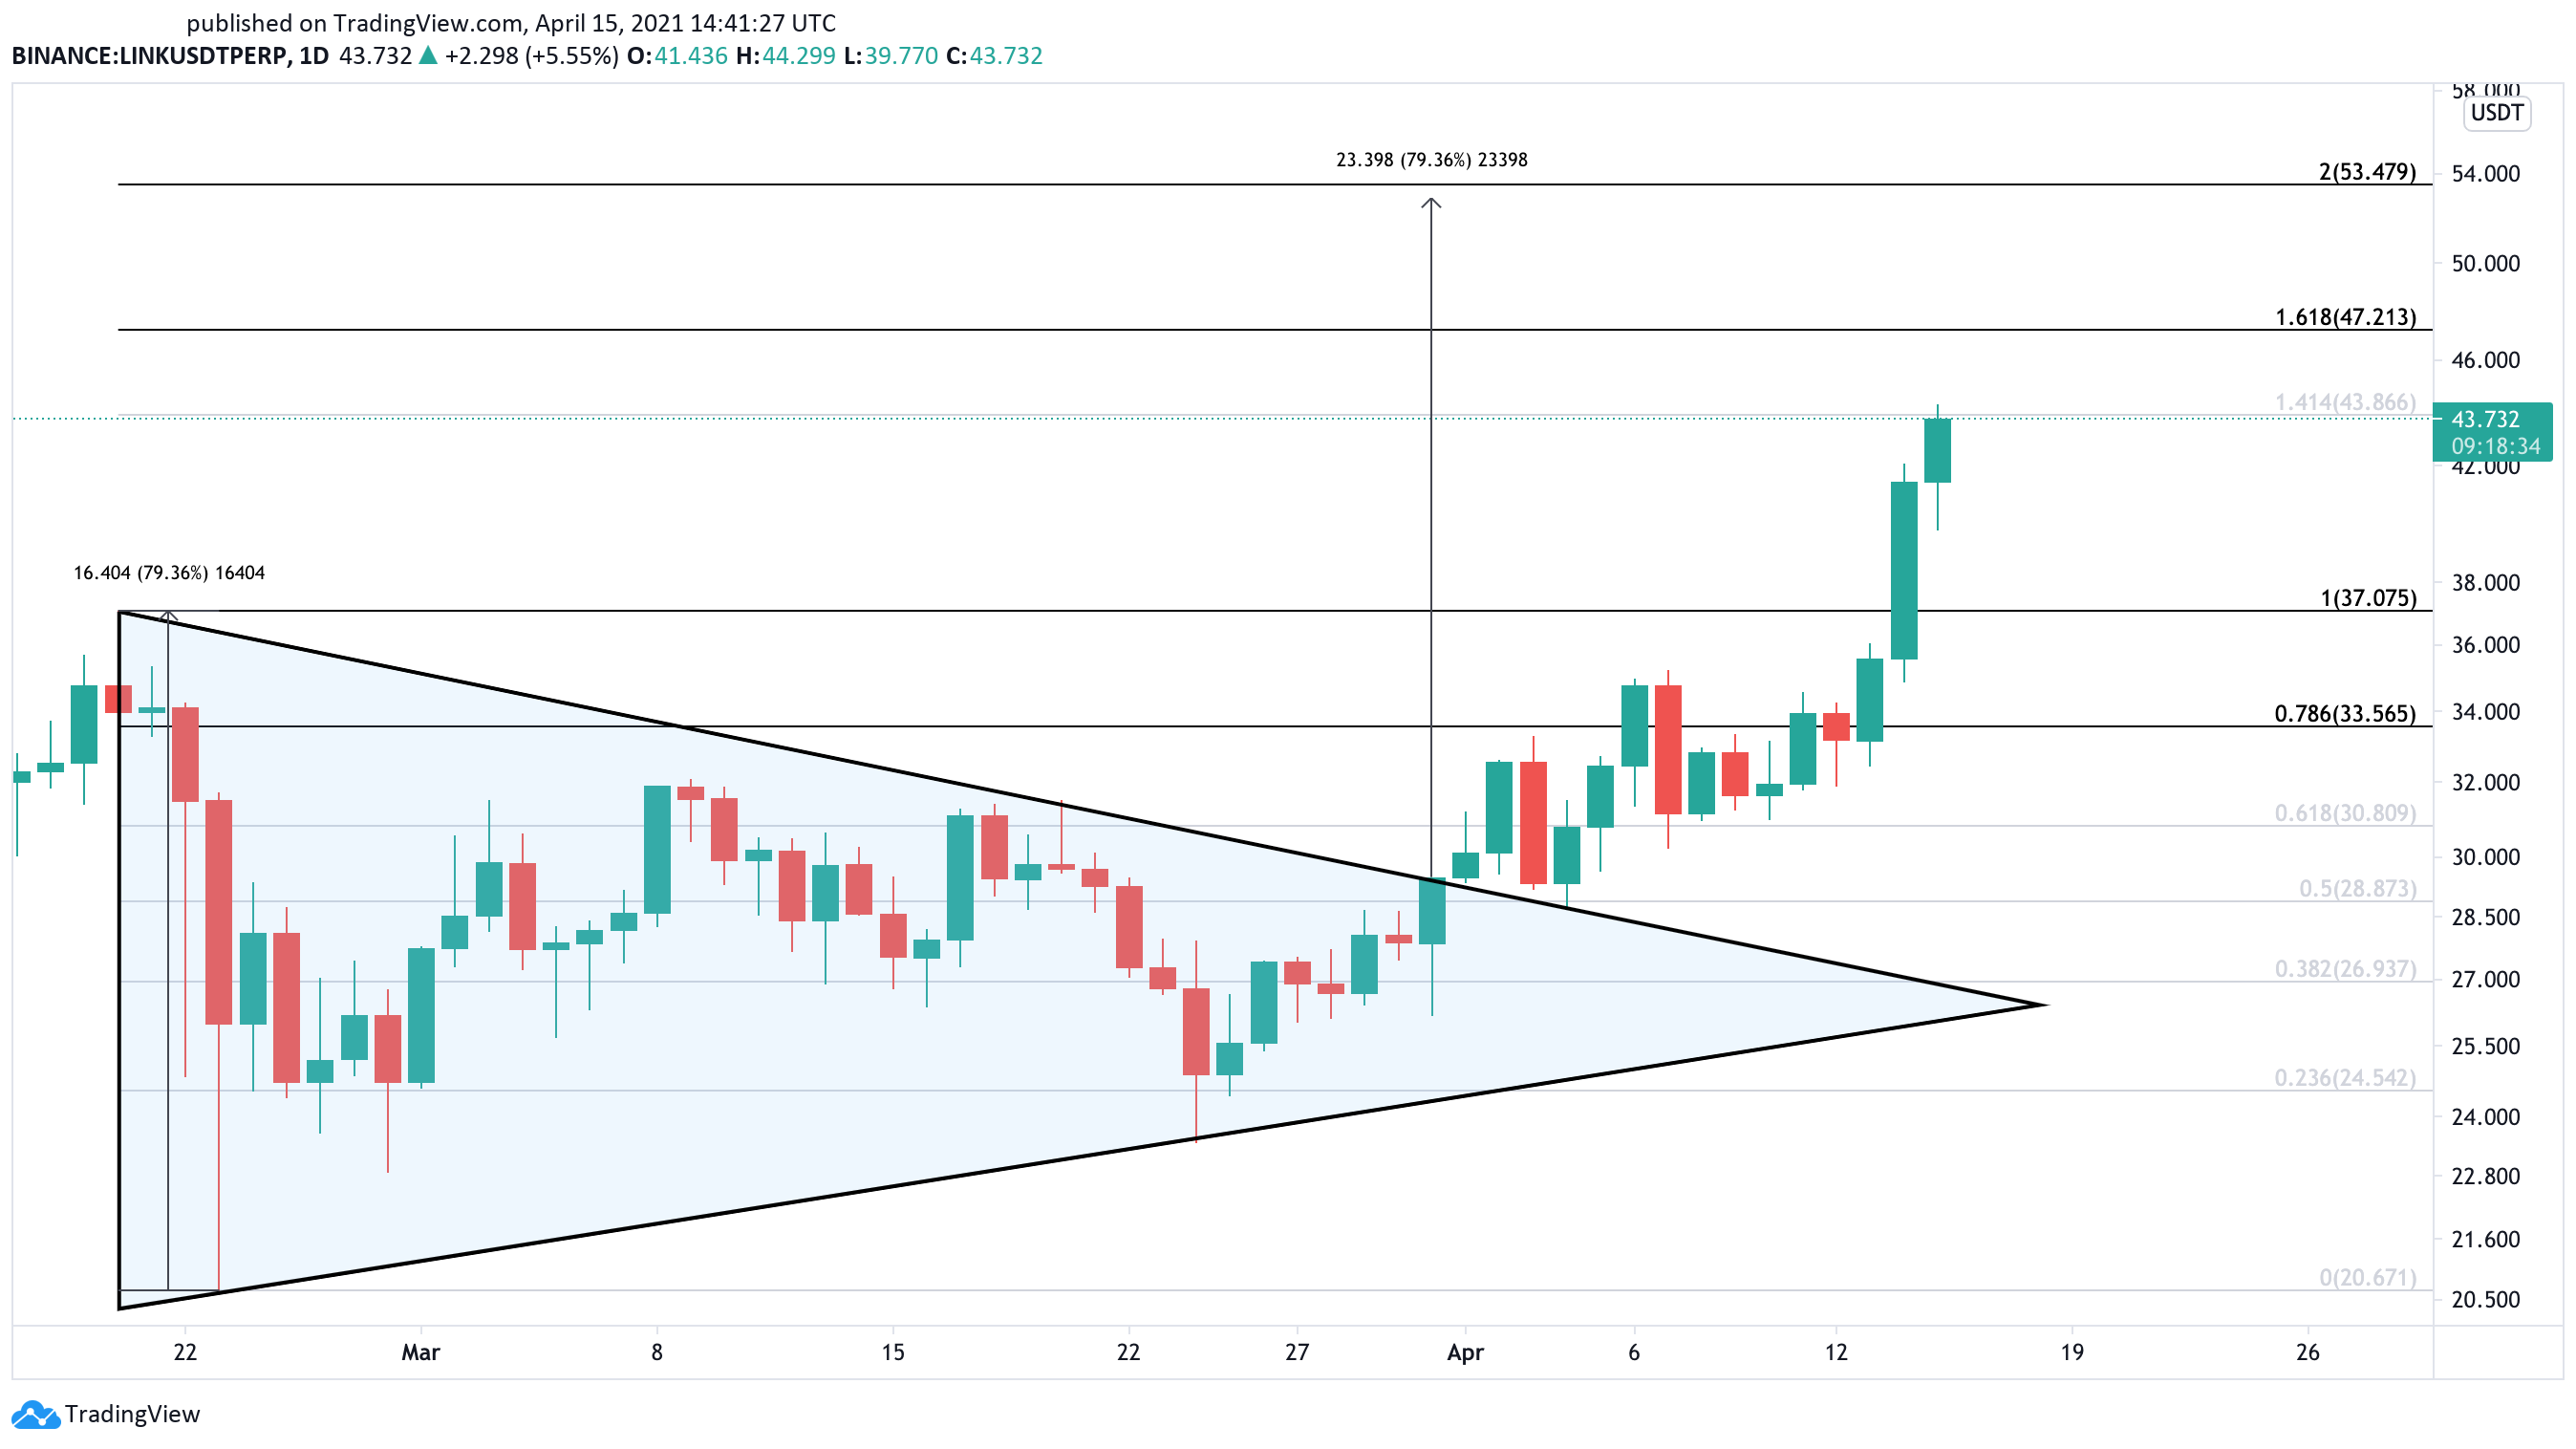
The release of Chainlink 2.0 comes when LINK has broken out of a symmetrical triangle on Mar. 31 and has risen over 50% since then, hitting a new all-time high of $44.30 recently.

Oracle Tokens Chainlink, Band Protocol Enter New Bull Rally
LINK/USDT on TradingView

Further buying pressure could push Chainlink by another 19% toward the 200% Fibonacci retracement level at $53.50 – measured from the Feb. 20 high of $37 to the Feb. 23 low of $20.70. 

This target is determined by measuring the height of the triangle’s y-axis and adding that distance upward from the breakout point.

After Google Integration, Band Moons

Speculation mounts around BAND after Google Cloud announced that it would integrate the decentralized oracles protocol. The cloud computing services platform will use Band Protocol’s standard dataset to enable real-time analysis of financial time series data. 

The goal is to allow developers to build hybrid blockchains and cloud applications using decentralized oracles.

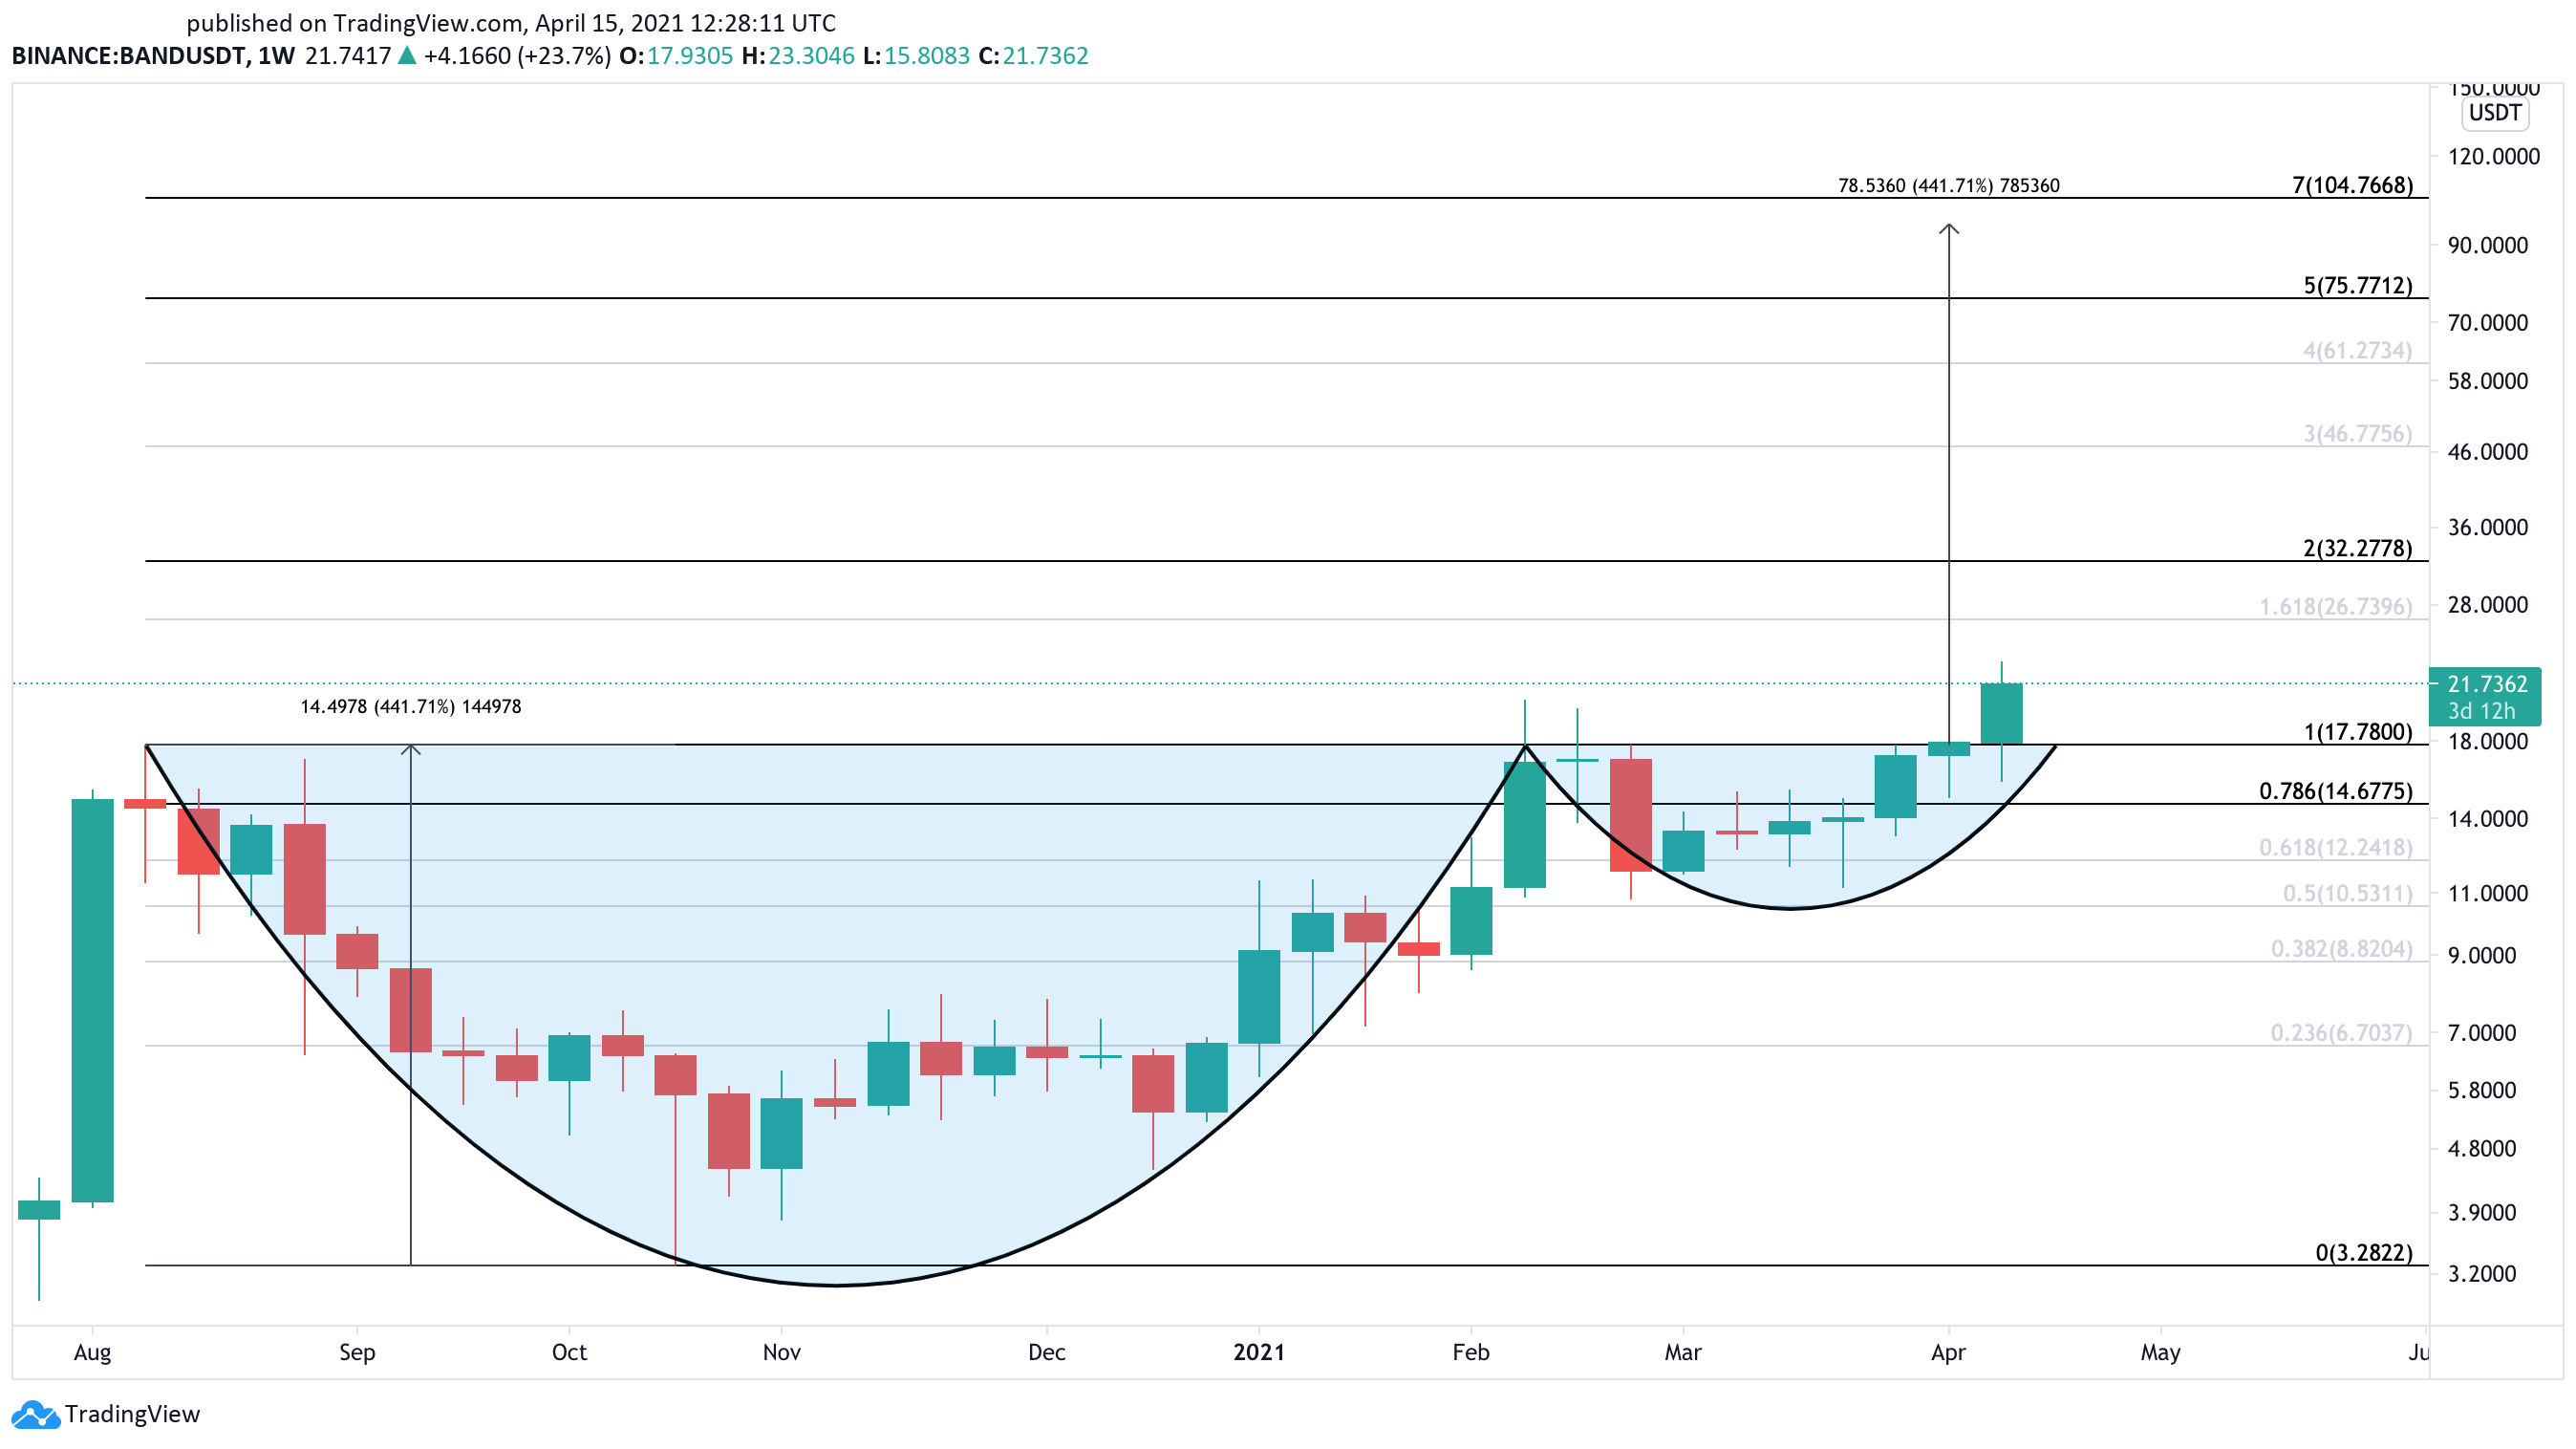
Following the announcement, BAND surged by more than 30%. The sudden bullish impulse allowed this cryptocurrency to break out of a cup and handle formation that had been developing in its weekly chart since mid-August 2020.

Band Protocol US dollar price chart
BAND/USDT on TradingView

If buy orders continue to pile up, Band Protocol could rise another 300% toward the 500% or 700% Fibonacci retracement level – measured from the Aug. 10, 2020 high of $17.80 to the Oct. 23, 2020, low of $3.30. 

These potential interest areas sit at $75.80 and $104.80, respectively. 

Such an optimistic target is determined by measuring the height between the bottom of the cup and the $17.80 barrier, then adding that distance upward from the breakout point.

Disclosure: At the time of writing, this author held Bitcoin and Ethereum.

MicroStrategy completes $3 billion convertible notes offering to buy more Bitcoin

Oracle Projects Surge in Value: Weekly Stats Show LINK, Band, DIA, API3 Captured 2-Digit Gains

Oracle Projects Surge in Value: Weekly Stats Show LINK, Band, DIA, API3 Captured 2-Digit GainsFollowing the boom of non-fungible tokens (NFT) tied to NFT marketplaces and tools, oracle-based tokens are now seeing their valuations rise. During the last seven days, a number of oracle tokens have seen steep gains between 7% to even 45%. Oracles Token Projects See Seven Day Gains Jump Not too long ago, tokens associated with […]

MicroStrategy completes $3 billion convertible notes offering to buy more Bitcoin