1. Home
  2. Chainlink

Chainlink

Google Cloud integrates Band Protocol for real-time crypto price data

Pricing oracles are playing a leading role in driving blockchain adoption.

Google Cloud is incorporating core technology from Band Protocol, a decentralized oracle service, to enable “immediate and accurate analysis of financial time series data,” according to Kevin Lu, head of business development at Band. 

Lu announced Thursday that Band’s Standard Dataset is now live on Google BigQuery, an enterprise data warehouse powering ultra-fast SQL queries. Lu described the partnership as “one of the direct collaborations with the Google Cloud team to enable traditional, hybrid blockchain and cloud applications to be built which use decentralized oracles.”

He continued:

"Our teams are empowering researchers and developers to use decentralized oracles for any external data source or type, regardless if the application is natively built on the blockchain or Web 2, through the flexible design of Band Protocol oracles."

Google Cloud has figured out how to translate financial time series data into real-time analytics using machine learning. That data will come directly from Band’s public dataset via BigQuery.

Band launched in September 2019 as an ERC-20 token before migrating over to the Cosmos chain in June 2020. The protocol has quickly emerged as one of the major competitors to Chainlink, the blockchain industry’s leading oracle service provider. The protocol’s native BAND token has enjoyed tremendous success as of late as cross-chain interoperability and new developments surrounding DeFi continue to lure investors.

With respect to DeFi, oracles play an important role in securely transmitting financial data, such as price and trading volume, to various blockchain networks. DeFi remains one of the biggest growth stories in all of crypto, with more than $121 billion locked into various decentralized finance protocols at the time of writing.

Ripple and Mercado Bitcoin to launch crypto-enabled payments in Brazil

Oracle Tokens Chainlink, Band Protocol Enter New Bull Rally

Chainlink and Band Protocol have recently made new all-time highs. Though some investors may take advantage of the rising price action to book profits, these cryptocurrencies show no signs of slowing.

Chainlink Looks Unstoppable

Chainlink made headlines after releasing a new whitepaper that details how the project plans to execute “hybrid smart contracts.” The new architecture will expand the network’s utility by adding new services to the off-chain computation of data. 

“Hybrid smart contracts are about combining blockchain smart contract application capabilities, and the off-chain world’s proof and data and computations. This is a big leap forward because it redefines what people can build,” said Chainlink’s co-founder Sergey Nazarov.

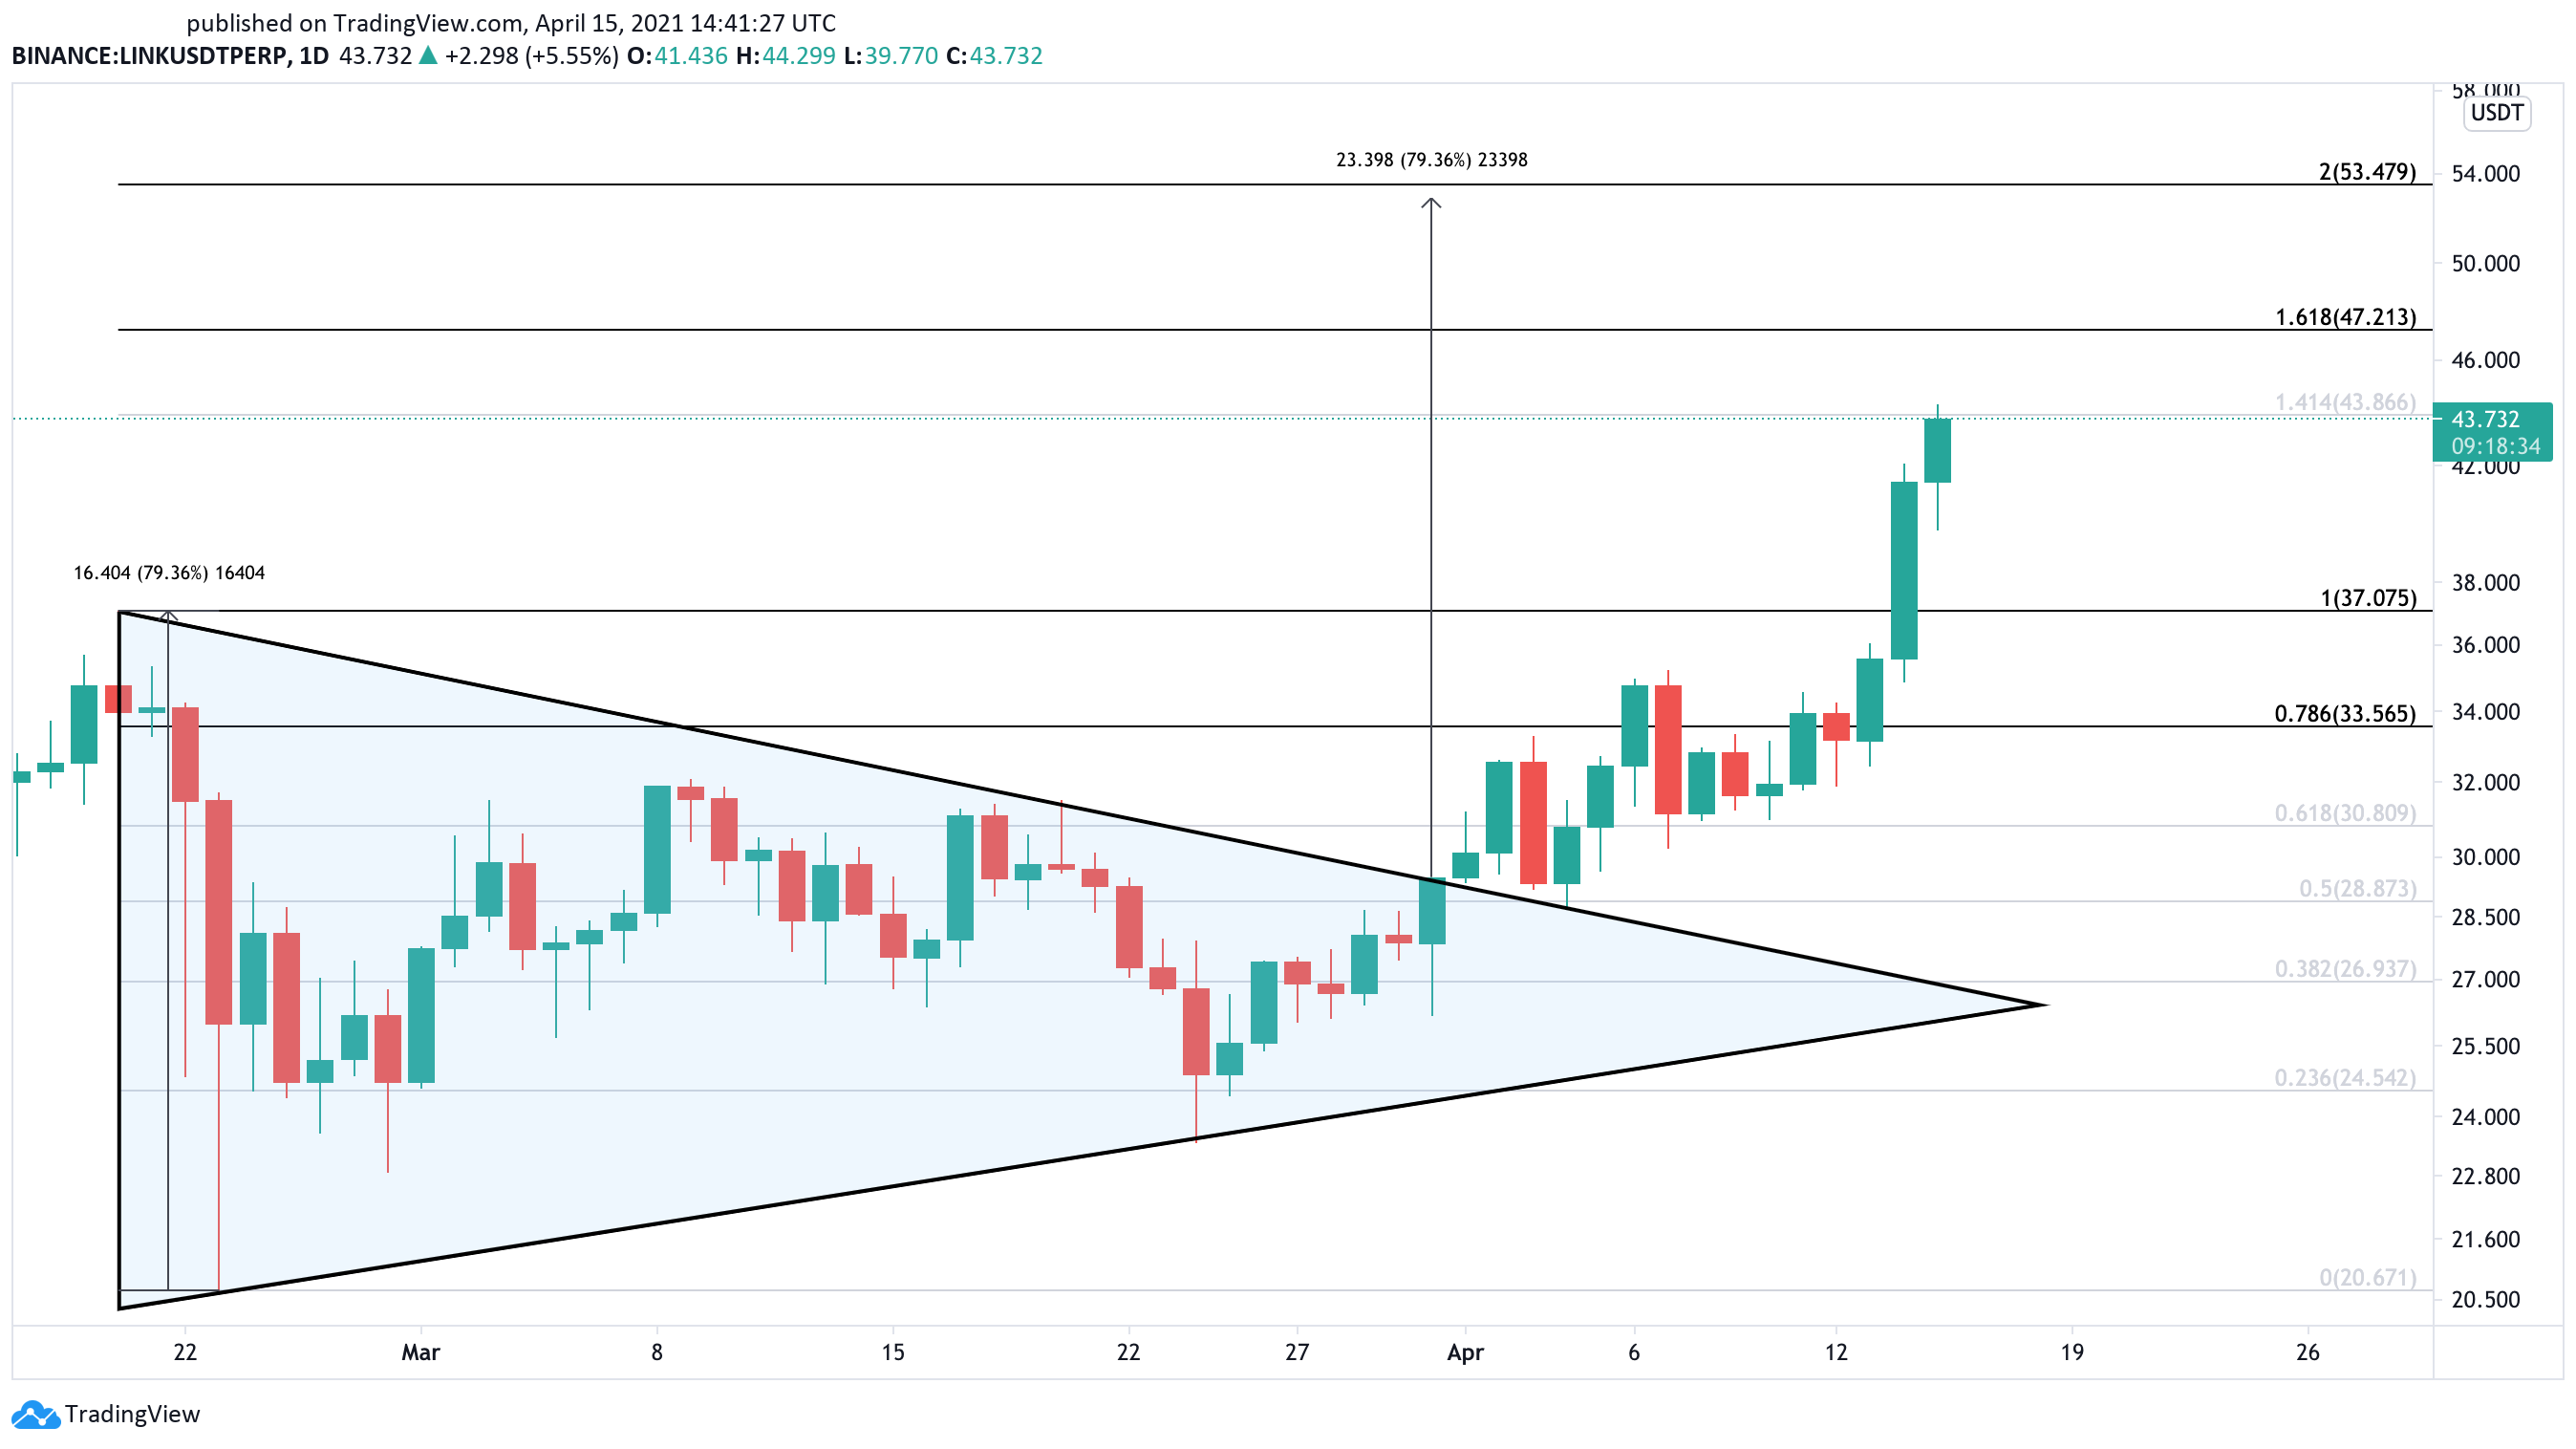
The release of Chainlink 2.0 comes when LINK has broken out of a symmetrical triangle on Mar. 31 and has risen over 50% since then, hitting a new all-time high of $44.30 recently.

Oracle Tokens Chainlink, Band Protocol Enter New Bull Rally
LINK/USDT on TradingView

Further buying pressure could push Chainlink by another 19% toward the 200% Fibonacci retracement level at $53.50 – measured from the Feb. 20 high of $37 to the Feb. 23 low of $20.70. 

This target is determined by measuring the height of the triangle’s y-axis and adding that distance upward from the breakout point.

After Google Integration, Band Moons

Speculation mounts around BAND after Google Cloud announced that it would integrate the decentralized oracles protocol. The cloud computing services platform will use Band Protocol’s standard dataset to enable real-time analysis of financial time series data. 

The goal is to allow developers to build hybrid blockchains and cloud applications using decentralized oracles.

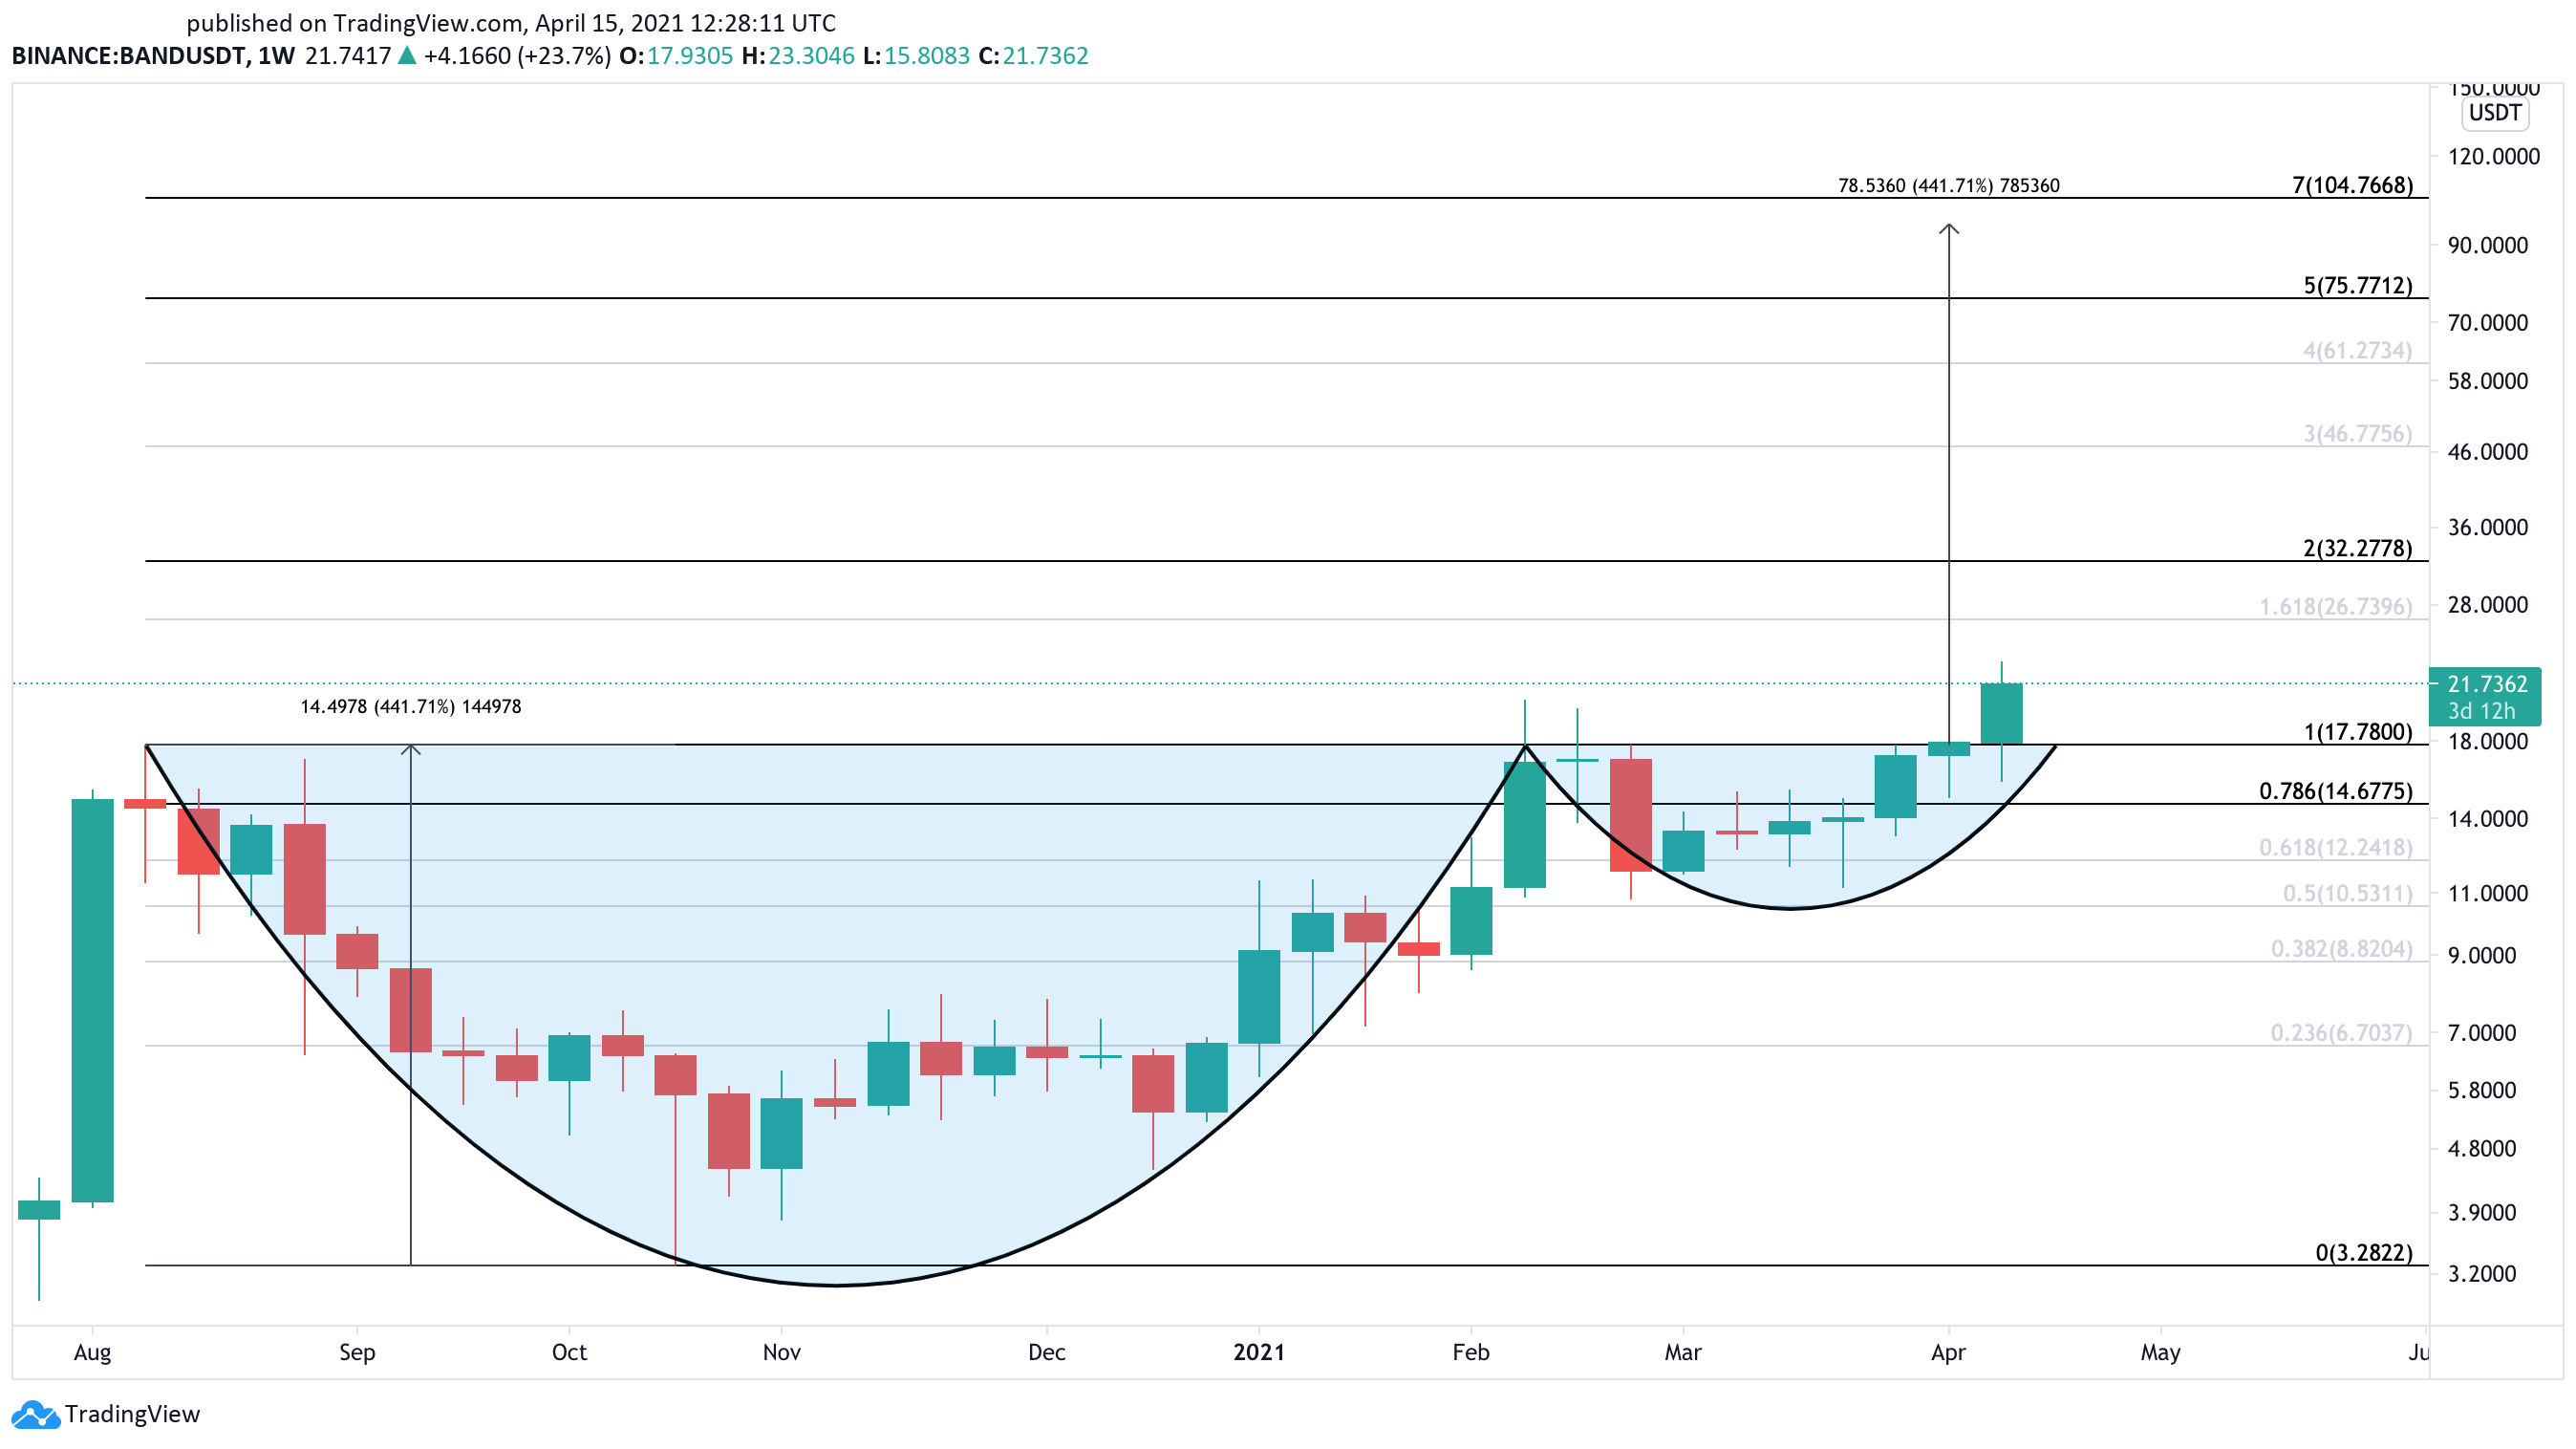
Following the announcement, BAND surged by more than 30%. The sudden bullish impulse allowed this cryptocurrency to break out of a cup and handle formation that had been developing in its weekly chart since mid-August 2020.

Band Protocol US dollar price chart
BAND/USDT on TradingView

If buy orders continue to pile up, Band Protocol could rise another 300% toward the 500% or 700% Fibonacci retracement level – measured from the Aug. 10, 2020 high of $17.80 to the Oct. 23, 2020, low of $3.30. 

These potential interest areas sit at $75.80 and $104.80, respectively. 

Such an optimistic target is determined by measuring the height between the bottom of the cup and the $17.80 barrier, then adding that distance upward from the breakout point.

Disclosure: At the time of writing, this author held Bitcoin and Ethereum.

Ripple and Mercado Bitcoin to launch crypto-enabled payments in Brazil

Chainlink releases new whitepaper in a shift toward smart contract computations

In its new vision, Chainlink would allow anyone to deploy an arbitrary executable on its network.

Chainlink (LINK) has unveiled its new whitepaper on Thursday, which details a planned expansion and pivot into creating oracle networks for computation. The proposal would see Chainlink generalize its oracle network into a “meta layer” of Decentralized Oracle Networks, or DONs.

The new architecture supports a larger selection of use cases, expanding its suite of services to off-chain computation of data. In Chainlink’s vision, these computational oracles would create a class of “hybrid smart contracts” where part of the logic could be offloaded to the oracles.

The new oracle networks would continue to focus on functions that blockchains or even layer-two networks are unable to perform, as Sergey Nazarov, co-founder of Chainlink, explained to Cointelegraph. An existing example of this framework is the Chainlink Verifiable Randomness Function, offering a crucial component for any on-chain lottery that needs a trusted source of randomness. In Chainlink’s view, this reliance makes these apps an existing example of hybrid smart contracts. “The DeFi contracts, 95% of them — everything except the DEXs — are hybrid smart contracts already,” Nazarov added, referring to their use of external price feeds.

In the vision outlined in the whitepaper, Chainlink would generalize and extend its existing computational capabilities:

“The extension here is really in the fact that you can put an arbitrary executable in an oracle network for it to run that. And this greatly expands what an Oracle network can do.”

Nazarov disclaimed that Chainlink is not attempting to replace existing blockchains or layer-two solutions. Its aim is to be a flexible and customizable solution to compute data, which could be used to scale existing DApps or even just run rollup schemes and other layer-two solutions. Chainlink would offer the choice of consensus mechanisms and nodes to each individual user, who will choose the trust guarantees they need.

“The Chainlink network is a configurable set of validators that can be configured to do whatever the hell you want them to. [...] It’s not a blockchain. They [the validators] don't give you the state and all the guarantees of a blockchain, but they can give you every other type of computation that you want to configure them into doing.”

The practical uses of such a network will largely depend on what the users wish to do, but Chainlink expects a number of services to take priority. One of these is the Fair Sequencing Service, a solution against miner extractable value, or MEV. The idea behind the platform is to let the oracles compute a “fair” sequence of transactions that would minimize value extraction generated from front-running trades and other techniques. As Nazarov explained, blockchains don’t have a conception of time, which is part of the reason why ordering transactions fairly is difficult, and why oracle networks can help.

Oracle-based computation to assist certain blockchain transactions are not entirely new, with Chainlink being the most notable provider of specialized data. Recently, the Maker team also proposed using its oracle for a similar purpose by instantly verifying the validity of an optimistic rollup and facilitating instant withdrawals from layer-two through Dai.

The new Chainlink whitepaper introduces a host of other features as well, notably offering a more robust incentive to report fraudulent transactions called super-linear staking. In this mechanism, bribing a Chainlink node to provide false data becomes quadratically more expensive as more stake is committed to the network. The system relies on mathematical fraud proofs that entitle watchers to the combined stake of all nodes if they correctly report an instance of fraud. A potential attacker would need to bribe all watchers for the full amount that they’d stand to gain, an amount greatly exceeding the total stake.

The new conception for the Chainlink network aims to vastly simplify the deployment of smart contracts. According to Nazarov, too many teams are forced to build core infrastructure just to support their DApp:

“I want them to just pop in and kind of build this hybrid smart contract really quickly, just the way they build it in the web world — you know, in a weekend. And they don't have to figure all this shit out! That's what I think the future is.”

Ripple and Mercado Bitcoin to launch crypto-enabled payments in Brazil

Price analysis 4/14: BTC, ETH, BNB, XRP, ADA, DOT, UNI, LTC, DOGE, LINK

Today's Coinbase (COIN) listing is likely to remain a focal point that will dictate the short-term price action in Bitcoin and altcoins.

Coinbase (COIN) listing on Nasdaq could eventually boost cryptocurrency adoption and attract droves of institutional investors. However, that is unlikely to happen immediately. In the first few days after the listing, volatility could be high as Wall Street tries to value Coinbase. This could also increase the volatility in cryptocurrencies. 

Sharp movements in the price of Bitcoin (BTC) could also result in liquidations of leveraged positions in the derivatives market. The massive $27 billion in Bitcoin futures open interest and $8 billion in Ether (ETH) futures open interest indicate that a spike in volatility could chop several traders.

Daily cryptocurrency market performance. Source: Coin360

PlanB, the analyst behind the popular stock-to-flow price model for Bitcoin, cited the monthly Relative Strength Index (RSI) indicator and said that the current reading of above 92 is high but falls short of the 95 levels hit in the previous bull markets of 2017, 2013 and 2011.

According to PlanB’s calculation, Bitcoin’s price would have to rise to $92,000 by the end of April to push the RSI to 95.

Traders will keep a close watch on the price action in COIN and that is likely to determine the short-term sentiment. Let’s study the charts of the top-10 cryptocurrencies to identify the critical support and resistance levels.

BTC/USDT

Bitcoin broke above the stiff overhead resistance at $61,825.84 on April 13, indicating the resumption of the uptrend. The sharp rally also completed the breakout from the inverse head and shoulders pattern that has a target objective at $69,540.

BTC/USDT daily chart. Source: TradingView

The upsloping 20-day exponential moving average ($58,713) and the RSI above 63 suggest the bulls have the upper hand. However, the BTC/USDT pair is unlikely to run away vertically.

Usually, after the breakout from a critical level, the price retraces and retests the level. In this case, the pair could drop to $60,000. If the bulls can flip this level into support, the pair could resume its uptrend.

On the contrary, if the bears sink the price below the 20-day EMA, it could catch several aggressive bulls off guard. That could intensify the selling and the pair may even crack the 50-day simple moving average ($55,241). Such a move will increase the possibility of a deeper correction.

ETH/USDT

Ether broke above the $2,200 resistance on April 13, which resumed its uptrend. The upsloping 20-day EMA ($2,040) and the RSI above 70 suggest the path of least resistance is to the upside.

ETH/USDT daily chart. Source: TradingView

The bulls will now try to push the ETH/USDT pair toward the next target objective at $2,618.14.

Contrary to this assumption, if the pair turns down from the current level, it could drop to the 20-day EMA. If the price rebounds off this support, it will suggest that the bulls are buying on dips as they anticipate the rally to rise further.

Alternatively, a break below the 20-day EMA will suggest that traders are booking profits in a hurry. That may pull the price down to the trendline.

BNB/USDT

Binance Coin (BNB) is currently in a corrective phase following the sharp uptrend that took it from $233.81 on March 26 to $638.56 on April 12, a 173% rally in a short time. The first strong support on the downside is the 38.2% Fibonacci retracement level at $483.95.

BNB/USDT daily chart. Source: TradingView

If the price bounces off $483.95, it will suggest the sentiment remains positive and the bulls are accumulating on dips. The buyers will try to resume the uptrend by thrusting the price above $638.56. If they succeed, the BNB/USDT pair could start its journey toward $888.70.

The Doji candlestick pattern today suggests indecision among the bulls and the bears. If this uncertainty resolves to the downside and the bears sink the price below $483.85, the pair could drop to the 20-day EMA ($417), which is likely to act as a strong support.

XRP/USDT

The strong up-move in XRP continued with a breakout above $1.50 on April 13 and reached an intraday high at $1.96 today. However, the price has reversed sharply, which suggests the bears are aggressively defending the psychological level at $2.

XRP/USDT daily chart. Source: TradingView

The first support on the downside is the 38.2% Fibonacci retracement level at $1.43. A strong rebound off this support will indicate that the sentiment remains bullish and traders are buying on dips. The bulls will then again try to resume the up-move by pushing the price above $1.96.

On the other hand, a break below $1.43 could pull the price down to the 20-day EMA ($1.05). Such a deep fall will suggest that traders are dumping their positions in a hurry, which may delay the next leg of the rally.

ADA/USDT

Cardano (ADA) pierced the $1.48 overhead resistance today and climbed to an intraday high at $1.55. However, the bulls have not been able to sustain the breakout as seen from the long wick on the candlestick.

ADA/USDT daily chart. Source: TradingView

The bears have pulled the price back into the $1.48 to $1.03 range. They will now try to sink the ADA/USDT pair to the 20-day EMA ($1.24).

If the price rebounds off the 20-day EMA, the bulls may make one more attempt to push the pair above the overhead resistance at $1.55. If they succeed, the pair could rally to $2.

On the contrary, if the bears sink the price below the moving averages, a drop to $1.03 is possible.

DOT/USDT

The tight range trading in Polkadot (DOT) resolved to the upside on April 13 and the bulls pushed the price above the $42.28 overhead resistance. However, the price has again dipped back below $42.28 today, indicating selling at higher levels.

DOT/USDT daily chart. Source: TradingView

If the bears pull the price below the 20-day EMA ($39.78), the selling could intensify and the DOT/USDT pair could drop to $32.50.

On the contrary, if the price rebounds off the 20-day EMA, the bulls will again try to clear the overhead hurdle at $46.80. If they succeed, the pair could start the next leg of the uptrend that could reach $53.50 and then $57.

UNI/USDT

Uniswap (UNI) broke out to a new all-time high on April 12 but the bulls are finding it difficult to sustain the momentum. The altcoin formed an inside day candlestick pattern on April 13 and has extended its correction today.

UNI/USDT daily chart. Source: TradingView

If the price turns up from the current level and breaks above $38.16, the UNI/USDT pair could start the next leg of the uptrend. The first target on the upside is $43.43 and if this resistance is crossed, the pair could march toward the psychological mark at $50.

On the contrary, if the bears sink the price below $33, the pair could lose momentum as the bulls who bought the breakout on April 12 may rush to the exit. That could pull the price down to the 20-day EMA ($31) and keep the pair range-bound for a few more days.

LTC/USDT

Litecoin (LTC) flipped the breakout level at $246.96 into support on April 11 and 12. This reignited buying from the bulls and the altcoin resumed its uptrend on April 13. The next target objective to watch on the upside is $307.42.

LTC/USDT daily chart. Source: TradingView

The 20-day EMA ($227) is rising and the RSI is close to the overbought territory, suggesting the bulls are in command.

However, the long-legged Doji candlestick pattern today shows indecision among the bulls and the bears. If the price slips below $255, the LTC/USDT pair could drop to the $239 to $246.96 support zone.

A strong rebound off this zone will suggest the bulls are accumulating on dips while a break below it could drag the price down to the 20-day EMA.

DOGE/USDT

Dogecoin (DOGE) broke above the stiff overhead resistance at $0.087 on April 13, indicating the resumption of the uptrend. The breakout has been followed by further buying today, which has propelled the price to an all-time high at $0.145.

DOGE/USDT daily chart. Source: TradingView

The sharp rally of the past few days has pushed the RSI above 85, which suggests the rally is getting overheated in the short term. The bears may try to stall the up-move at $0.15. If they manage to do that, the DOGE/USDT pair could enter a minor correction or consolidation.

The first support on the downside is the 38.2% Fibonacci retracement level at $0.112. A bounce off this support will suggest strength. The bulls will then again try to resume the uptrend. If they can propel the price above $0.145, the pair could move up to $0.20.

On the other hand, a break below $0.112 could result in a drop to the breakout level at $0.087.

LINK/USDT

The bulls have propelled Chainlink (LINK) above the $36.93 overhead resistance today, indicating the resumption of the uptrend. If the bulls can sustain the price above $36.93, the altcoin could continue its march toward $50.

LINK/USDT daily chart. Source: TradingView

The 20-day EMA ($32) has turned up and the RSI has risen above 65, suggesting the bulls are back in the driver’s seat.

However, if the bulls fail to sustain the price above the $36.93 level, then it will indicate aggressive selling by the bears at higher levels. That could result in a drop to the 20-day EMA. A strong rebound off this level will suggest the sentiment remains positive.

Conversely, if the bears sink the LINK/USDT pair below the 20-day EMA, it will suggest that the current breakout was a bull trap.

The views and opinions expressed here are solely those of the author and do not necessarily reflect the views of Cointelegraph. Every investment and trading move involves risk. You should conduct your own research when making a decision.

Market data is provided by HitBTC exchange.

Ripple and Mercado Bitcoin to launch crypto-enabled payments in Brazil

Price analysis 4/12: BTC, ETH, BNB, XRP, ADA, DOT, UNI, LTC, LINK, XLM

Altcoins continue to press higher while Bitcoin bulls work on holding the $60,000 level as support.

Bloomberg Intelligence senior commodity strategist Mike McGlone equated the current consolidation in Bitcoin (BTC) price to that of a “caged bull, well-rested to escape.” When compared with the rallies a year after the previous two Bitcoin halvings in 2012 and 2016, the strategist called the current price action “tame.’

According to McGlone, Bitcoin is “still in price-discovery mode” and its plateau is still far away.

While Bitcoin remains in focus, altcoins have continued to steal the show. Bitcoin’s market dominance, which stood closer to 70% on Jan. 4 has continued to slide even though its price has risen more than 104% year-to-date. The current market dominance at 54.3% is the lowest since April 2019 according to data from CoinMarketCap. This suggests that several altcoins are outperforming Bitcoin by a large margin.

Daily cryptocurrency market performance. Source: Coin360

However, approval of a Bitcoin exchange-traded fund could tilt the advantage back in favor of Bitcoin. Mike Novogratz’s Galaxy Digital became the latest to file an application with the United States Securities and Exchange Commission for a Bitcoin ETF on Monday. The growing list of candidates applying to launch a Bitcoin ETF shows that there is still huge demand for the digital asset

Will Bitcoin continue to trade sideways while altcoins rally or will it resume its uptrend and lead from the front. Let’s analyze the charts of the top-10 cryptocurrencies to find out.

BTC/USDT

Bitcoin formed an inside day candlestick pattern on April 11, indicating indecision among the bulls and the bears. The bulls tried to resolve this uncertainty to the upside today by piercing the all-time high at $61,825.84, but the bears had other plans. They again successfully defended the overhead resistance.

BTC/USDT daily chart. Source: TradingView

Although the bears are defending the overhead resistance, they have not been able to sink the price further away from $60,000. This suggests the bulls are not closing their long positions in a hurry as they anticipate the uptrend to continue.

If the bulls can drive and sustain the price above $61,825.84, the BTC/USDT pair will complete a bullish inverse head and shoulders pattern. That could result in a rally to the pattern target at $69,540. If the momentum sustains, the next target to watch out for is $79,566.

This bullish view will invalidate if the pair turns down and breaks below the 50-day simple moving average ($54,7823). Such a move could signal the start of a deeper correction.

ETH/USDT

Ether (ETH) has been trading above the breakout level at $2,040.77 for the past three days, but the up-move lacks momentum. The long wick on the April 10 candlestick and the inside day candlestick pattern on April 11 suggests hesitation by the bulls to push the price higher.

ETH/USDT daily chart. Source: TradingView

If the price does not pick up momentum within the next few days, the bears will try to pull the price back below $2,040.77. If the ETH/USDT pair breaks below the 20-day exponential moving average ($1,985), the next stop could be the trendline. A break below this support could signal the start of a deeper correction.

However, the upsloping 20-day EMA and the relative strength index (RSI) above 61 indicate advantage to the bulls. If the bulls punch the price above $2,200 with force, the pair may start the next leg of the uptrend that could reach $2,618.14.

BNB/USDT

Binance Coin (BNB) is in a strong uptrend, but the up-move of the past two days is showing signs of a melt-up. The long wick on today’s candlestick suggests some traders are booking profits at higher levels.

BNB/USDT daily chart. Source: TradingView

Although the 20-day EMA ($385) is sloping up, the RSI above 84 indicates the rally is overheated in the short term. This could result in a minor correction or consolidation for the next few days. In strong uptrends, the corrections generally do not last for more than three days.

The first support on the downside is the 38.2% Fibonacci retracement level at $483.95. If the price rebounds off this support, it will suggest the sentiment remains positive and bulls are buying on dips. They will then try to resume the uptrend by pushing the price above the all-time high at $638.56.

If they succeed, the next leg of the uptrend could begin, which may propel the BNB/USDT pair to $888.70. On the contrary, if bears sink the price below $483.95, the pair could drop to the 20-day EMA.

XRP/USDT

The volatility contraction on April 9 was resolved to the upside on April 10 and XRP rallied above $1.11. The bulls continued their purchase on April 11 and pushed the price to $1.50. However, the long wick on the day’s candlestick suggests traders booked profits at higher levels.

XRP/USDT daily chart. Source: TradingView

The bears could not build up on the advantage today and start a correction. The bulls tried to resume the uptrend but failed, resulting in the formation of a Doji candlestick pattern. This suggests indecision among the bulls and the bears about the next directional move.

If the buyers can propel the price above $1.50, the XRP/USDT pair could rally to $2. Contrary to this assumption, if the price turns down and dips below $1.30, the pair could start a correction.

The major support on the downside is $1.11. If the buyers can flip this level into support, the pair will make one more attempt to rise above $1.50. On the other hand, a break below $1.11 may result in a drop to the 20-day EMA ($0.89).

ADA/USDT

The bulls successfully held Cardano (ADA) above the 50-day SMA ($1.17) in the past few days and are currently attempting to start an up-move. However, the long wick on today’s candlestick suggests that buying dries up above $1.33.

ADA/USDT daily chart. Source: TradingView

If the bulls fail to sustain the price above $1.33, the aggressive bears may again try to sink the price below the 50-day SMA. If they manage to do that, the ADA/USDT pair could drop to the $1.03 to $0.98 support zone.

A rebound off this zone could keep the pair range-bound for a few more days. Alternatively, if the bears sink the price below the zone, the pair could decline to $0.80.

This negative view will invalidate if the pair sustains the price above $1.33. That could push the price to $1.48. A break above this resistance could start the next leg of the uptrend that may reach $2.

DOT/USDT

Polkadot (DOT) has been sandwiched between the 20-day EMA ($39.30) and the overhead resistance at $42.28 for the past few days. However, this tight range trading is unlikely to continue for long.

DOT/USDT daily chart. Source: TradingView

If the bulls can propel the price above $42.28, the DOT/USDT pair could rally to $46.80. The bears may again offer resistance at this level but if the bulls can overcome the barrier the pair could climb up to $53.50 and then $57.

The marginally upsloping 20-day EMA and the RSI above 54 suggest only a minor advantage to the bulls. If the bears can sink the price below the moving averages, it will open the gates for a decline to $32.50 and then $26.50.

UNI/USDT

Uniswap (UNI) has soared above the all-time high at $36.80 today. Although the moving averages are yet to turn up, the RSI has risen close to the overbought territory, indicating a pick-up in momentum.

UNI/USDT daily chart. Source: TradingView

If the bulls can sustain the price above $35.20, it will suggest strong demand at higher levels. The UNI/USDT pair could then march up to $43.43 and if this level also gets taken out, the up-move may hit $50.

Contrary to this assumption, if the bulls fail to sustain the price above $35.20, it will suggest that traders are booking profits at higher levels. If the price dips and sustains below $35.20, the range-bound action in the pair could continue.

LTC/USDT

Litecoin’s (LTC) volatility contraction on April 8 and 9 was followed by an expansion in favor of the bulls. The buyers pushed the price above $246.96 on April 10 and have successfully managed to sustain the price above it since then.

LTC/USDT daily chart. Source: TradingView

The upsloping 20-day EMA ($218) and the RSI above 63 suggest the path of least resistance is to the upside. If the buyers can drive the price above $262.93, the LTC/USDT pair could rally to its next target objective at $307.42.

This bullish view will invalidate if the price breaks and sustains below $246.96. Such a move will suggest that traders booked profits at higher levels. The critical support to watch on the downside is the 20-day EMA.

A strong bounce off it will suggest the sentiment remains positive and the bulls will once again try to resume the uptrend. Conversely, a break below the 20-day EMA could pull the price down to $170.

LINK/USDT

Chainlink (LINK) is stuck between $24 and $36.93. The marginally rising 20-day EMA ($30.92) and the RSI above 55 suggest the bulls have a slight edge. However, the failure of the bulls to challenge the $36.93 overhead resistance indicates that demand dries up at higher levels.

LINK/USDT daily chart. Source: TradingView

The bears are currently trying to sink the price below the $32 support. If they can accomplish that, the possibility of a break below the moving averages increases. Such a move could pull the price down to $24.

Contrary to this assumption, if the price bounces off the 20-day EMA, the bulls will make one more attempt to drive the price above $36.93. If they succeed, the LINK/USDT pair could resume its uptrend and rally toward $40 and then $50.

XLM/USDT

The bulls are attempting to resume the uptrend in Stellar Lumens (XLM) but they are facing stiff resistance at the $0.60 level. The bulls pushed the price above the overhead resistance on April 11 and today but they could not sustain the breakout.

XLM/USDT daily chart. Source: TradingView

If the bulls do not allow the price to slip below $0.55, it will suggest accumulation on dips. The upsloping 20-day EMA ($0.47) and the RSI near the overbought territory suggest the bulls are in control.

A breakout and close above $0.60 will be the first sign that bulls have overpowered the bears. If that happens, the XLM/USDT pair could resume the uptrend and rally to $0.72 and then $0.85.

On the other hand, if the bears sink the price below $0.55, the pair could drop to the 20-day EMA.

The views and opinions expressed here are solely those of the author and do not necessarily reflect the views of Cointelegraph. Every investment and trading move involves risk. You should conduct your own research when making a decision.

Market data is provided by HitBTC exchange.

Ripple and Mercado Bitcoin to launch crypto-enabled payments in Brazil

Price analysis 4/9: BTC, ETH, BNB, XRP, ADA, DOT, UNI, LTC, LINK, THETA

The rally in Bitcoin and select altcoins seems to have hit a wall as bears continue to aggressively push back at key overhead resistance levels.

Hong Kong tech company Meitu revealed on April 8 that it had added $10 million worth of Bitcoin (BTC) to its holdings which were purchased at an average rate of $57,000 per coin. After the latest purchase, Meitu’s total cryptocurrency portfolio consists of $49.5 million worth of Bitcoin and $50.5 million worth of Ether (ETH). This acquisition shows that institutional investors are confident that the rally in Bitcoin is still in its early stages.

Tom Jessop, Fidelity’s head of the crypto division, believes that Bitcoin has reached a tipping point and that traditional finance companies will continue to adopt cryptocurrency aggressively in the next few years. Jessop believes the massive monetary stimulus from governments and central banks has accelerated institutional adoption and this is a trend that could extend for at least another year.

Daily cryptocurrency market performance. Source: Coin360

It is not only institutional investors who are rushing into cryptocurrencies. Data shows that the number of retail investors trading cryptocurrency has also increased. Popular trading app Robinhood reported on April 8 that crypto trading on its platform surged to 9.5 million users in Q1 2021, a six-fold increase over Q4 2020.

While crypto adoption is on the rise, some legacy finance firms are still taking an anti-crypto approach. HSBC has reportedly blacklisted MicroStrategy stock and will not allow customers on its HSBC InvestDirect platform to buy shares from the company.

Will Bitcoin and major altcoins extend their uptrend and attract more buyers or will they enter a corrective phase? Let’s analyze the charts of the top-10 cryptocurrencies to find out.

BTC/USDT

The bears could not capitalize on Bitcoin’s break below the 20-day exponential moving average ($57,043) on April 7. Their failure to break the 50-day simple moving average ($54,572) support could have attracted buying from the aggressive bulls, resulting in the rebound on April 8.

BTC/USDT daily chart. Source: TradingView

However, today's Doji candlestick suggests the bulls are struggling to sustain the momentum at higher levels.

The BTC/USDT pair has formed an inverse head and shoulders pattern that will complete on a breakout and close above $60,000. This bullish setup has a target objective at $69,540. If the bulls sustain the momentum and clear this hurdle, the uptrend may reach the next target at $79,566.

Contrary to this assumption, if the price turns down from the current level, the bears will once again try to break the critical support at the 50-day SMA. If they succeed, the selling could intensify as short-term traders may rush to the exit. That could pull the pair down to $50,460.02 and then $43,006.77.

ETH/USDT

Ether’s (ETH) drop on April 7 was arrested at the 20-day EMA ($1,933), which shows the bulls are accumulating on dips. The price rebounded sharply on April 8 and rose above the resistance at $2,040.77.

ETH/USDT daily chart. Source: TradingView

The bulls will now make one more attempt to climb above the all-time high at $2,150. If they manage to do that, the ETH/USDT pair could resume its uptrend and march toward the next target objective at $2,618.14.

However, the bears are likely to have other plans. They will try to pull the price below the 20-day EMA. If that happens, several aggressive bulls may get trapped. That could intensify the selling, resulting in a drop to the trendline. A break below this support will suggest a change in trend.

BNB/USDT

Binance Coin (BNB) continues to be in a strong uptrend. The bulls flipped the $348.69 level to support on April 7 and followed that up with a breakout to a new all-time high on April 8. This shows a strong appetite from the bulls.

BNB/USDT daily chart. Source: TradingView

The upsloping moving averages and the relative strength index (RSI) above 75 indicate that the bulls are in command. The next target objective on the upside is the $500 to $530 zone where the bears may mount a stiff resistance.

On any correction, the first support to watch out for is the 20-day EMA ($334). A strong rebound off this support will suggest the sentiment remains bullish and traders are buying on dips.

However, if the BNB/USDT pair dips below the 20-day EMA, it will suggest that the bullish momentum is weakening.

XRP/USDT

XRP made successive inside day candlestick formations on April 7 and April 8. The current price action is pointing to another inside-day candlestick pattern today. The drop in daily volatility shows the altcoin is still digesting the recent gains.

XRP/USDT daily chart. Source: TradingView

This tightening of the intraday range usually ends with a strong breakout. If the uncertainty resolves to the upside and the bulls drive the price above $1.11, the XRP/USDT pair could start the next leg of the rally that could take it to $1.34 and then $1.66.

Alternatively, if the indecision resolves to the downside, it will suggest that supply exceeds demand and traders have dumped their positions. If that happens, the pair could drop to the 20-day EMA ($0.72). A break below this level could pull the price down to $0.65.

ADA/USDT

Cardano (ADA) dipped below the 20-day EMA ($1.18) on April 7 but the bulls did not allow the price to slip below the 50-day SMA ($1.16). This shows the bulls are defending the moving averages aggressively.

ADA/USDT daily chart. Source: TradingView

The buyers will now try to push the price above $1.33. If they manage to do that, the ADA/USDT pair could rise to $1.48. This is an important level to watch out for because the pair has returned from it on two previous occasions.

If the price again reverses direction from $1.48, it will suggest that the range-bound action may continue for a few more days. On the other hand, if the bulls can drive the price above $1.48, the pair could resume the uptrend toward the next target objective at $2.

A break below the moving averages will be the first sign of weakness and that could result in a drop to the $1.02 support. If this level breaks down, the bears could start a deeper correction to $0.80.

DOT/USDT

Polkadot (DOT) bounced off the 20-day EMA ($38.68) on April 7, indicating buying on dips. The bulls will now try to push the price above the overhead resistance at $42.28.

DOT/USDT daily chart. Source: TradingView

If they succeed, the DOT/USDT pair will retest the all-time high at $46.80. A breakout and close above this level could start the next leg of the rally that has a target objective at $53.50 and then $57.

The gradually upsloping 20-day EMA and the RSI in the positive territory suggest the bulls have the upper hand.

However, if the price turns down from the current level and breaks below the moving averages, it will indicate that traders are closing their positions on rallies. That could result in a fall to $32.50 and then $26.50.

UNI/USDT

The bulls successfully held the $27.97 support on April 7, which is a positive sign as it shows accumulation on dips. Uniswap (UNI) bounced back above the 20-day EMA ($29.65) on April 8 and the buyers will now try to push the price above $32.50.

UNI/USDT daily chart. Source: TradingView

If they succeed, the UNI/USDT pair could rally to the $35.20 to $36.80 overhead resistance zone. The bears are likely to defend this zone aggressively. If the price turns down from this resistance, the pair may extend its stay inside the range for a few more days.

Contrary to this assumption, if the price turns down from the current level, the bears will make one more attempt to pull the price below the $27.97 to $25.50 support zone. If they manage to do that, the pair could start a deeper correction to $20.74.

LTC/USDT

Litecoin (LTC) successfully completed the retest of the breakout level from the symmetrical triangle on April 7. That was followed by a rebound on April 8, but the bulls are struggling to pick up momentum.

LTC/USDT daily chart. Source: TradingView

This shows hesitation to buy at higher levels. If the bulls do not overcome the hurdle at $246.96 within the next few days, the possibility of a break below the 20-day EMA ($207) increases. In such a case, the LTC/USDT pair could drop to the support line.

Contrary to this assumption, if the bulls sustain the momentum and propel the price above $246.96, the pair could start the next leg of the uptrend that may reach $307.42. The gradually rising 20-day EMA and the RSI above 59 suggest a minor advantage to the bulls.

LINK/USDT

Chainlink’s (LINK) sharp reversal on April 7 could not break below the 20-day EMA ($30.29). This shows the sentiment remains positive and the bulls are buying on dips. The rebound on April 8 rose above the $32 resistance but the bulls are struggling to build on this strength today.

LINK/USDT daily chart. Source: TradingView

If the price turns down and breaks below the moving averages, it will suggest that supply exceeds demand at higher levels. That could pull the price down to the critical support at $24.

On the other hand, if the bulls again defend the 20-day EMA, the LINK/USDT pair could rise to the all-time high at $36.93. A breakout and close above this resistance will suggest the bulls have absorbed the supply and that may indicate the start of the next leg of the uptrend.

However, if the price again turns down from $36.93, the pair could extend its stay inside the range for a few more days.

THETA/USDT

After the large range day on April 7, THETA made an inside day candlestick pattern on April 8 and has followed it up with another one today. This shows indecision among the bulls and the bears about the next directional move. While the bears are defending the overhead resistance, the bulls are buying on every minor dip.

THETA/USDT daily chart. Source: TradingView

The upsloping 20-day EMA ($11.33) and the RSI above 62 suggest a minor advantage to the bulls. The buyers will have to clear the hurdle at $14 to signal the start of the next leg of the uptrend. If they manage to do that, the THETA/USDT pair could rally to $17.65 and then $22.50.

On the contrary, if the bears sink the price below the 20-day EMA, it will be the first sign of a possible change in sentiment. It will suggest that the bulls are no longer buying the dips to the 20-day EMA. The next critical support to watch will be $10.35. If this level is taken out, a deeper correction to the 50-day SMA may start.

The views and opinions expressed here are solely those of the author and do not necessarily reflect the views of Cointelegraph. Every investment and trading move involves risk. You should conduct your own research when making a decision.

Market data is provided by HitBTC exchange.

Ripple and Mercado Bitcoin to launch crypto-enabled payments in Brazil

CipherTrace and Chainlink Just Made DeFi More Compliant

CipherTrace’s DeFi Compli, a new compliance oracle on Chainlink, assists DeFi projects in following OFAC sanctions and block blacklisted cryptocurrency addresses.

CipherTrace to Keep DeFi Compliant

DeFi Compli is targeted at helping DeFi projects be compliant with the Office of Foreign Assets Control (OFAC), a financial intelligence agency that enforces economic sanctions supporting U.S. national security.

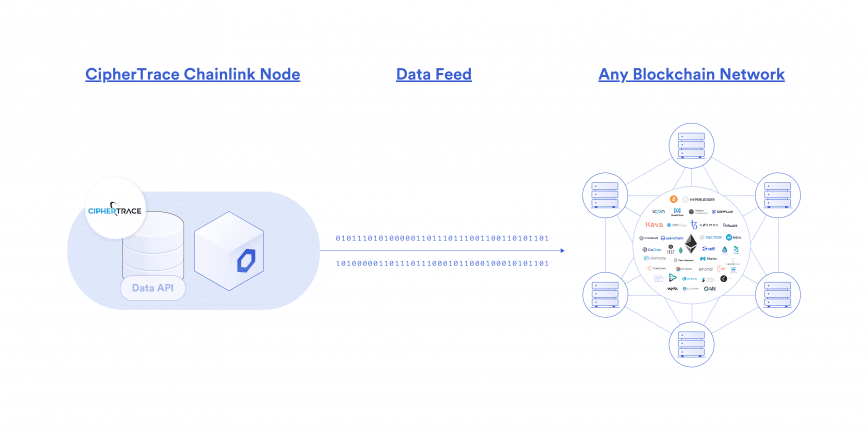
DeFi Compli has been developed on Chainlink, a decentralized oracle network that connects real-world data with any blockchain. As part of the solution, CipherTrace will implement a Chainlink node and provide relevant compliance feeds so teams can port them directly into smart contracts.

CipherTrace and Chainlink Just Made DeFi More Compliant

Like all other business sectors, DeFi activities such as swapping tokens, borrowing, and lending are subject to OFAC sanctions, along with anti-money laundering laws.

In March 2021, the Financial Action Task Force (FATF) published new guidance that specifies that most DeFi platforms resemble exchanges or VASPs (Virtual Asset Service Providers) and are therefore responsible for implementing AML and CFTC controls.

“Ensuring that sanctioned addresses cannot use DeFi to fund weapons of mass destruction programs should be among DEXs’ chief concerns right now,” said CipherTrace CEO Dave Jevans. “The time for DeFi to adopt compliance solutions is now, or risk facing the consequences.”

Ripple and Mercado Bitcoin to launch crypto-enabled payments in Brazil

The Most Viewed Crypto Videos: Ethereum Captured More Views on Youtube in 12 Months Than Bitcoin

The Most Viewed Crypto Videos: Ethereum Captured More Views on Youtube in 12 Months Than BitcoinTotal Processing, a merchant services company has published a study this week about the most-watched cryptocurrency videos on Youtube during the last year. Even though bitcoin has climbed 700% since last April, ethereum has climbed 1,100% and videos pertaining to ethereum have accumulated the most views since April 2020. Ethereum Videos Are the Most Viewed […]

Ripple and Mercado Bitcoin to launch crypto-enabled payments in Brazil

Taraxa to Integrate a Chainlink Timestamp Oracle for Tracking Informal Transaction Agreements

Taraxa is excited to announce the ongoing work towards integrating a timestamp oracle solution using the world’s leading decentralized oracle provider, Chainlink. This will provide the Taraxa blockchain with a decentralized and trusted source of time for all informal transactional agreements, enabling Taraxa’s smart contracts to leverage real-time data feeds from sources such as NIST […]

The post Taraxa to Integrate a Chainlink Timestamp Oracle for Tracking Informal Transaction Agreements appeared first on The Daily Hodl.

Ripple and Mercado Bitcoin to launch crypto-enabled payments in Brazil

The Missing Link: How Chainlink’s Pallet Aims to Deliver Greater Informational Access

The Missing Link: How Chainlink’s Pallet Aims to Deliver Greater Informational AccessAs demand for smart contracts climbs, Chainlink’s modular oracle for the Substrate framework aims to power developers and defi applications with trusted off-chain information and pricing data needed to attract projects to Polkadot and Kusama. Blistering Growth in Defi and Smart Contracts Beckon New Layer of Trust As the smart contract revolution continues to gain […]

Ripple and Mercado Bitcoin to launch crypto-enabled payments in Brazil