
Price analysis 1/9: SPX, DXY, BTC, ETH, BNB, XRP, DOGE, ADA, MATIC, LTC

DXY is cooling off and crypto and equities are starting to heat up. Cointelegraph explores how BTC and altcoins could react to the current bullish momentum in the market.
Investors across asset classes have been keeping a close watch on the United States Federal Reserve’s monetary policy because that sets the stage for a risk-on or a risk-off environment.
The strong rally in the U.S. stock markets on Jan. 6 and in cryptocurrencies over the weekend suggests that market observers anticipate the Fed to slow down its frantic pace of rate hikes. The optimism was fuelled by the greater-than-expected slowdown in wage gains in the December jobs report and the first contraction in U.S. services industry activity since May 2020. The next trigger that may influence the markets could be the Consumer Price Index data due on Jan. 12.
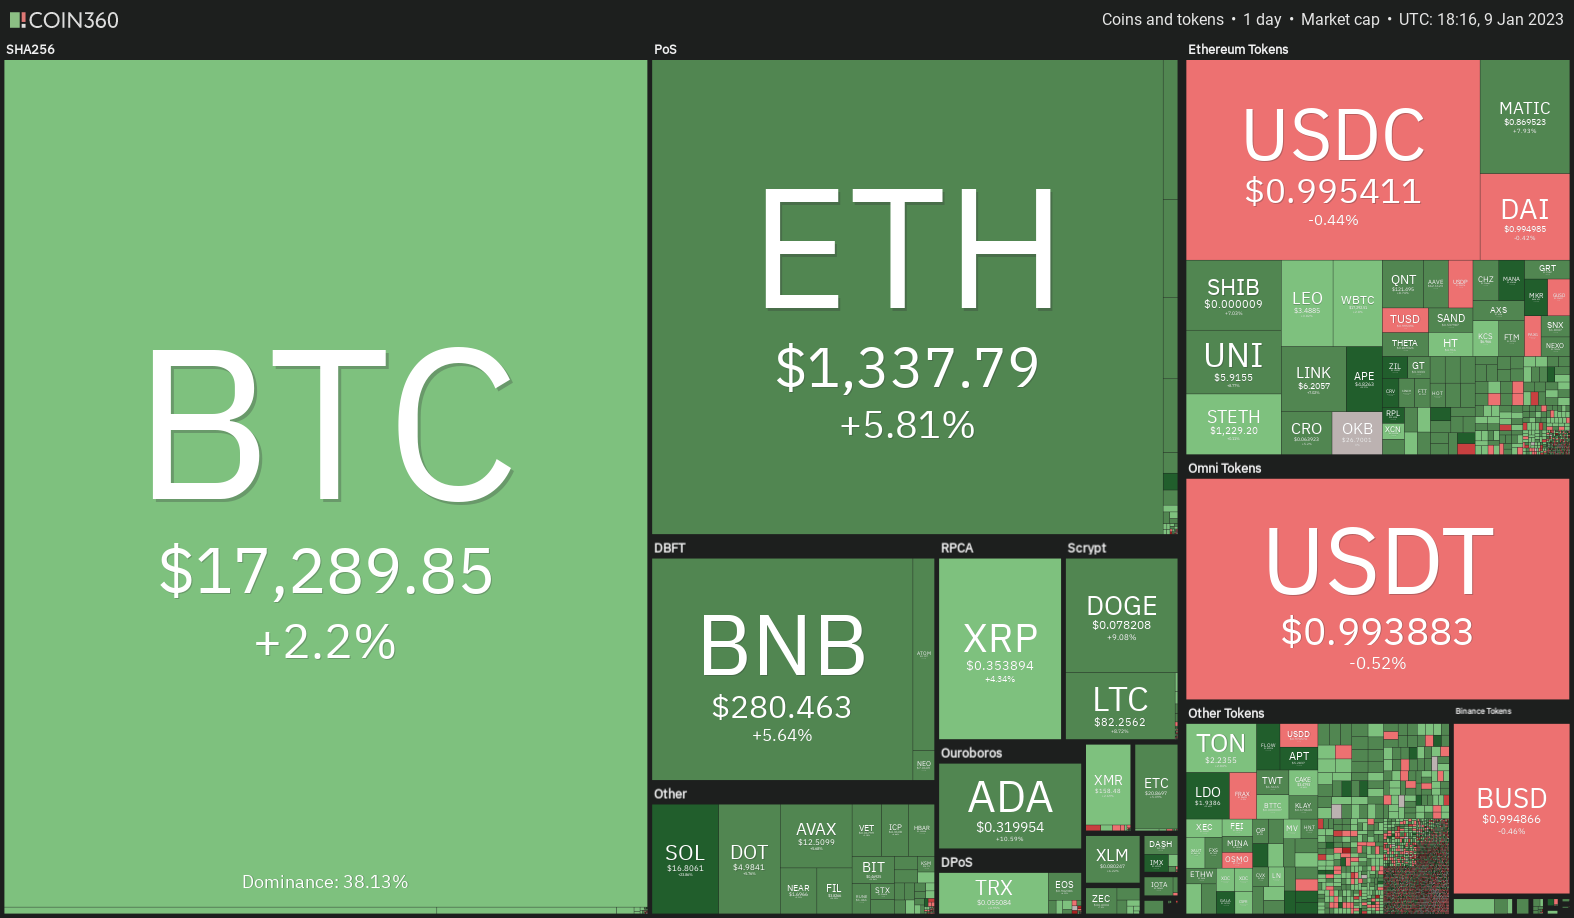
While the cryptocurrency markets may benefit from a risk-on environment, the extent of the up-move may be limited because of the issues plaguing Digital Currency Group. Therefore, along with the macroeconomic data, crypto traders must keep an eye on the news specific to the crypto space.
Could the strength in the S&P 500 (SPX) and the weakness in the U.S. dollar index (DXY) boost crypto prices higher? Let’s study the charts to find out.
SPX
After consolidating in a range for several days, the S&P 500 index broke above the 20-day exponential moving average (3,875) on Jan. 6. This suggests that the uncertainty has resolved in favor of the buyers.
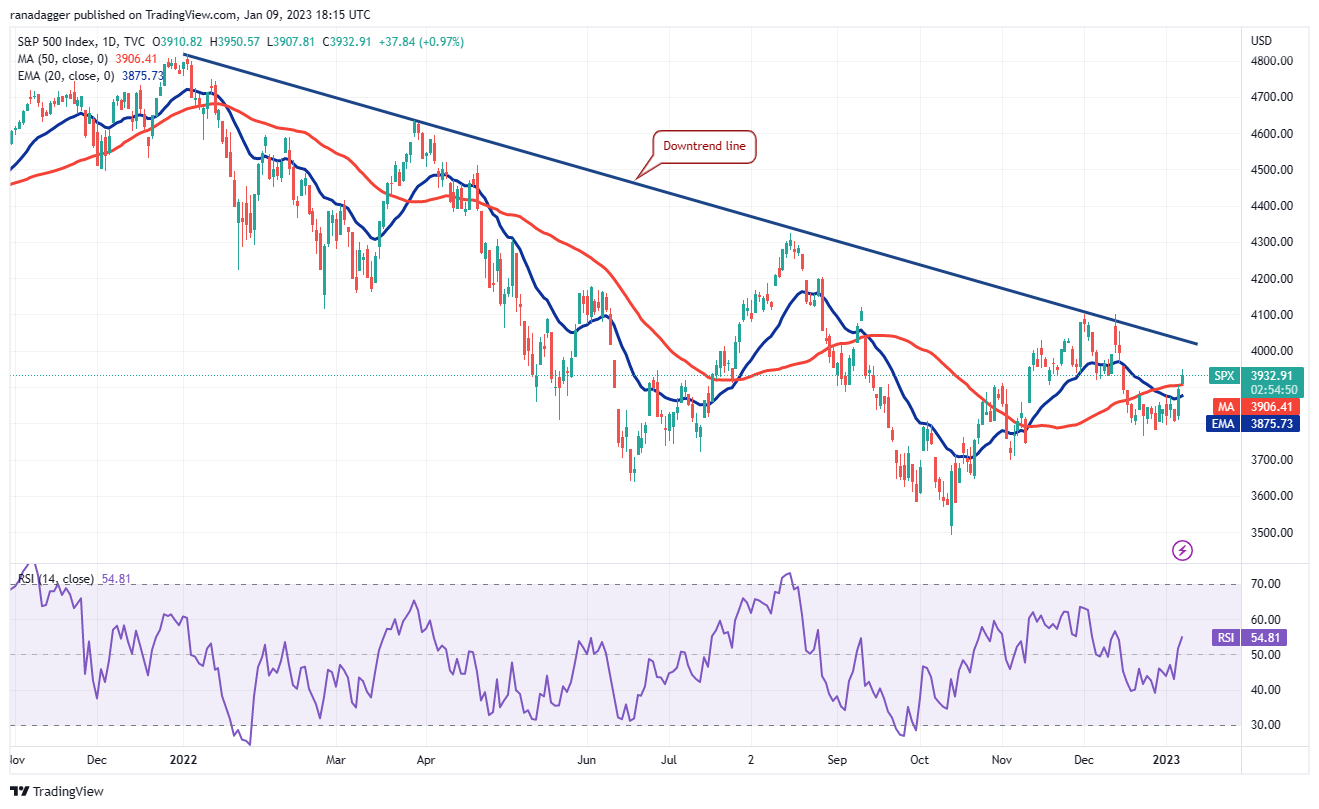
The bulls will try to strengthen their position by pushing the price to the downtrend line. This is an important level to keep an eye on because a break and close above it could signal a potential trend change. The index could then rally to 4,100 and later to 4,325.
Contrary to this assumption, if the index turns down from the current level or the overhead resistance, it will suggest that bears continue to sell on relief rallies. The bears will be back in the game if the price dips below the 20-day EMA.
DXY
The bulls pushed the price above the important resistance of 105 on Jan. 5 but they could not sustain the recovery on Jan. 6. This suggests that the bears continue to sell on rallies. The price turned down sharply and dipped back below the 20-day EMA (104).
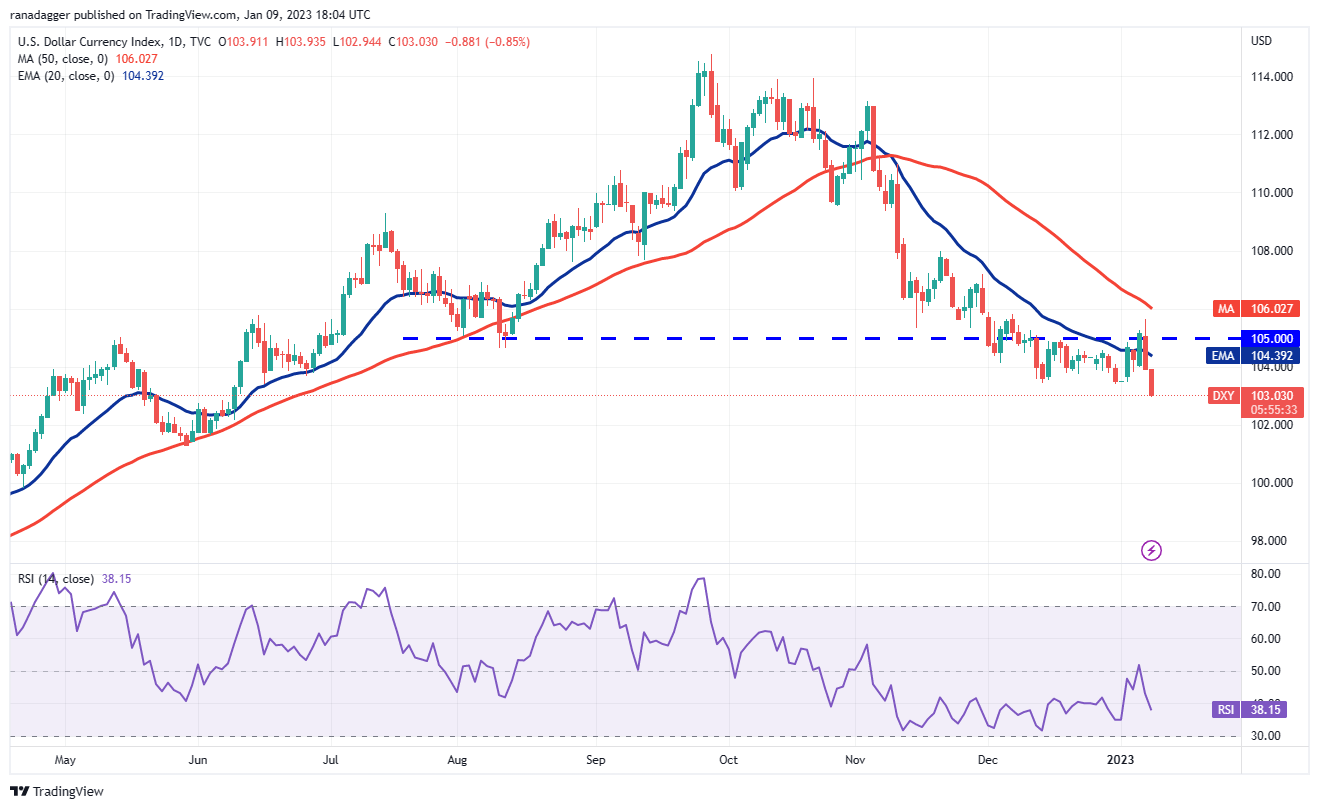
The selling continued on Jan. 9 and the bears have yanked the price below the immediate support near 103.39. If bears sustain the lower levels, it will signal the start of the next leg of the downtrend. The index could dive to 102 and then to the psychologically crucial level at 100.
Alternatively, if the price turns up sharply and rises above 103.39, it will suggest demand at lower levels. Buyers will then try to push the pair toward 105.82. A break and close above this resistance could tilt the short-term advantage in favor of the bulls.
BTC/USDT
Bitcoin (BTC) broke above the resistance of the $16,256 to $17,061 range on Jan. 8, indicating that the uncertainty has resolved in favor of the buyers.
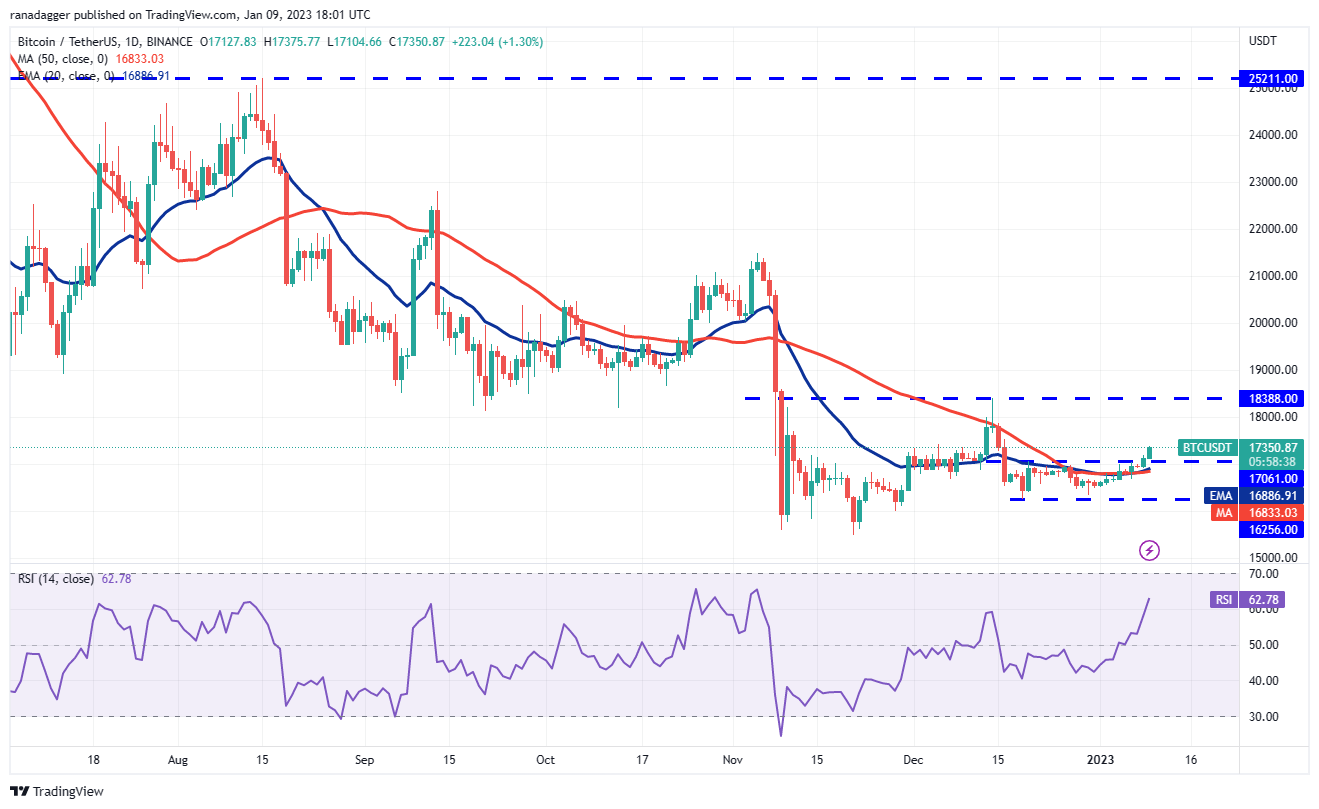
If bulls sustain the breakout level and succeed in flipping $17,061 into support, the BTC/USDT pair may start its northward march toward the overhead resistance at $18,388. This level could act as a major obstacle.
If the price turns down sharply from $18,388, it will suggest that the BTC/USDT pair may oscillate inside the large range between $16,256 and $18,388 for a while longer.
The short-term advantage could tilt in favor of the bears if they pull the price back below the moving averages.
ETH/USDT
Ether (ETH) has been gradually rising toward the overhead resistance at $1,352. The downtrend line is placed just above this level, hence the bears will try to defend it with all their might.

If buyers do not give up much ground from the overhead resistance, it will increase the likelihood of a breakout above the downtrend line. If that happens, it will suggest that the decline could be over. The ETH/USDT pair could first rally to $1,700 and thereafter to $1,800.
Contrary to this assumption, if the price turns down from $1,352 and slides below the moving averages, it will indicate that traders are selling near the resistance. That could keep the pair stuck inside the range between $1,150 and $1,352 for a few more days.
BNB/USDT
BNB (BNB) continued its up-move and soared above the 50-day simple moving average ($268) on Jan. 8. This suggests strong demand at higher levels.
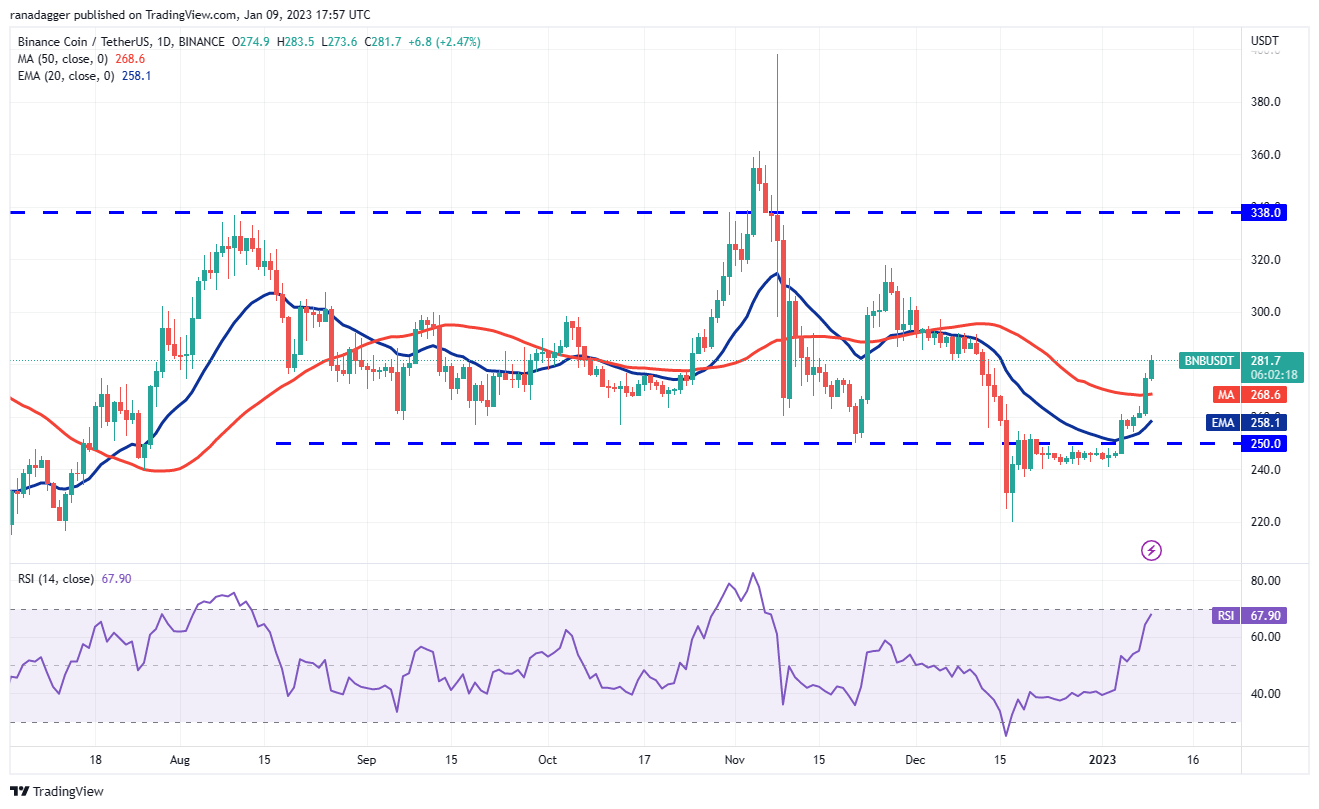
The 20-day EMA ($258) has started to turn up and the RSI is in the positive zone, indicating that the bulls have the upper hand. The BNB/USDT pair could rally to $300 and then jump to $318. This zone is likely to attract strong selling by the bears.
On the way down, the first support is at the 50-day SMA and then at the 20-day EMA. A break below the moving averages could signal that the bears are back in the driver’s seat. The pair could then tumble to $250.
XRP/USDT
The bears repeatedly failed to sustain the price below the support line of the symmetrical triangle in the past few days. This indicates that traders bought the dip in XRP (XRP).

The bulls will try to propel the price to the resistance line of the triangle. This is an important level to keep an eye on because a break and close above it could suggest the start of a new up-move. The XRP/USDT pair could then rally to $0.42 and later to the pattern target of $0.46.
Contrarily, if the price turns down from the current level or the resistance line, it will suggest that the pair may continue to trade inside the triangle. The bears will have to sink and sustain the price below the triangle to gain the upper hand.
DOGE/USDT
Dogecoin’s (DOGE) tight range trading resolved to the upside with a break above the 20-day EMA ($0.07) on Jan. 9. The price could next reach the 50-day SMA ($0.08) where the bears may pose a strong challenge.
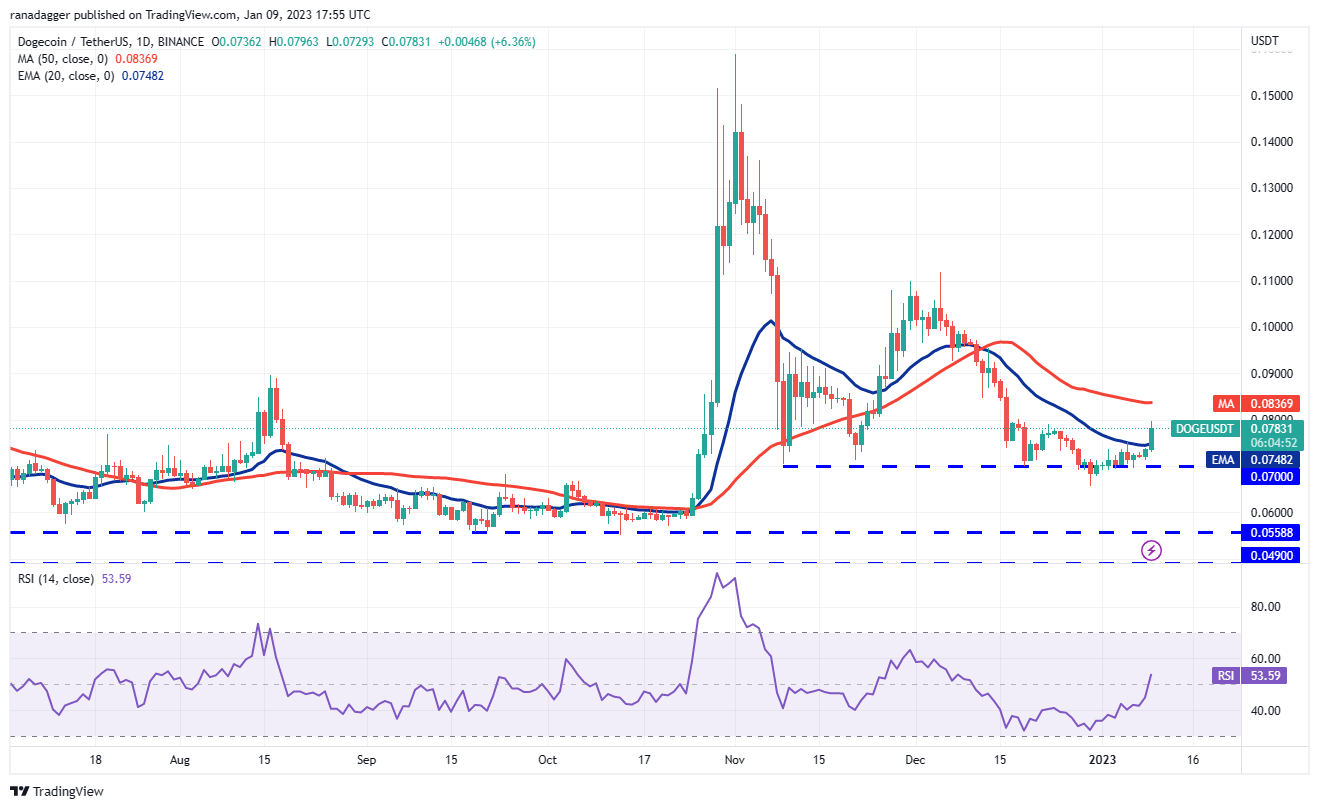
If the price turns down from the 50-day SMA but rebounds off the 20-day EMA, it will suggest that bulls are buying on dips. That could improve the prospects of a break above the 50-day SMA. The DOGE/USDT pair could then accelerate toward $0.11.
On the contrary, if the price turns down and breaks below the 20-day EMA, the bears will again try to sink the pair below the support near $0.07. If they manage to do that, the pair could start a downward move to $0.05.
Related: Why is Ethereum (ETH) price up today?
ADA/USDT
Cardano (ADA) continued its strong recovery and broke above the 50-day SMA ($0.29) on Jan. 8. That was followed by another sharp rally on Jan. 9, which took the price above the downtrend line of the falling wedge pattern.
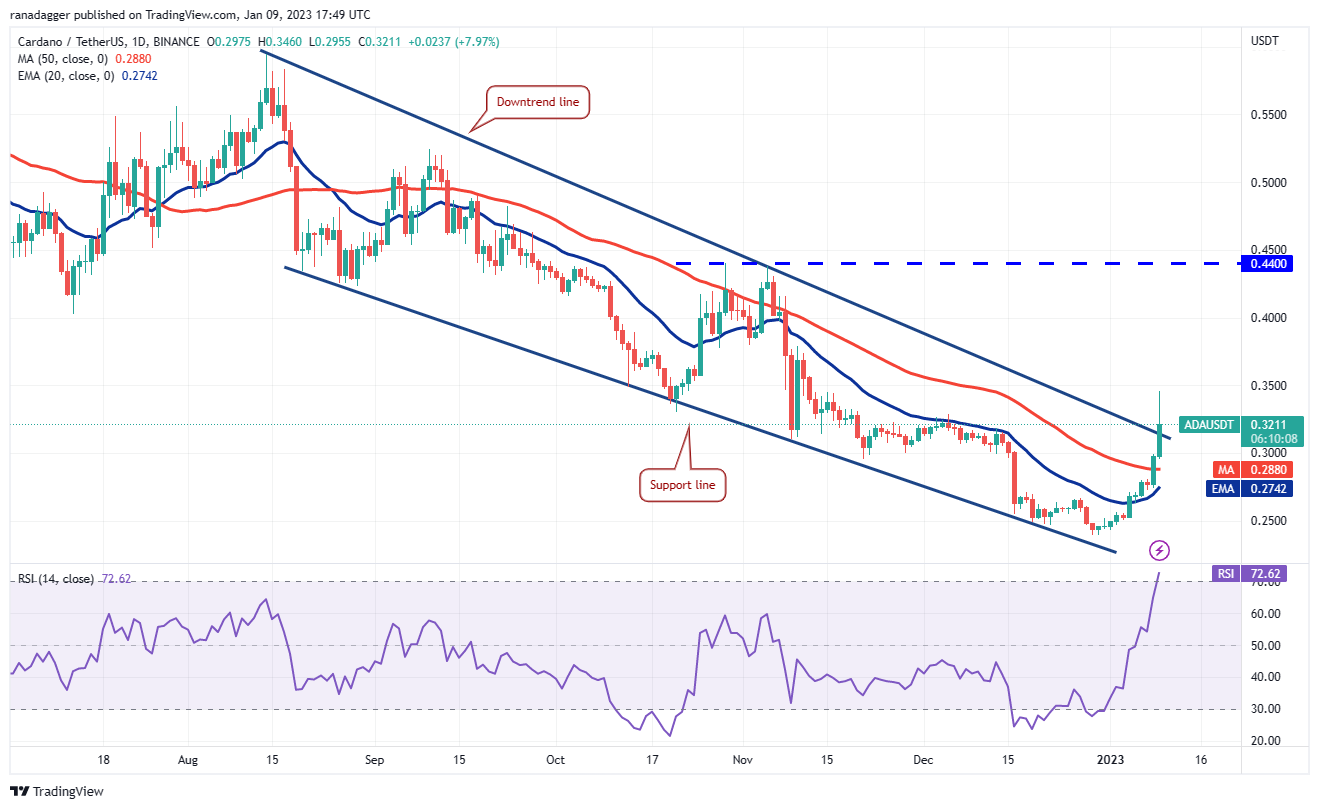
The 20-day EMA ($0.27) has started to turn up and the RSI has jumped into the overbought territory, indicating that bulls are in command. If buyers sustain the price above the wedge, the ADA/USDT pair could soar to $0.44.
However, the long wick on the Jan. 9 candlestick shows that the bears may not give up easily. This suggests that sellers are trying to trap the aggressive bulls by pulling the price back into the wedge. If they do that, the pair could slide to the 20-day EMA.

MATIC/USDT
Polygon (MATIC) climbed above the 20-day EMA ($0.81) on Jan. 8 and followed that up with another up-move on Jan. 9.
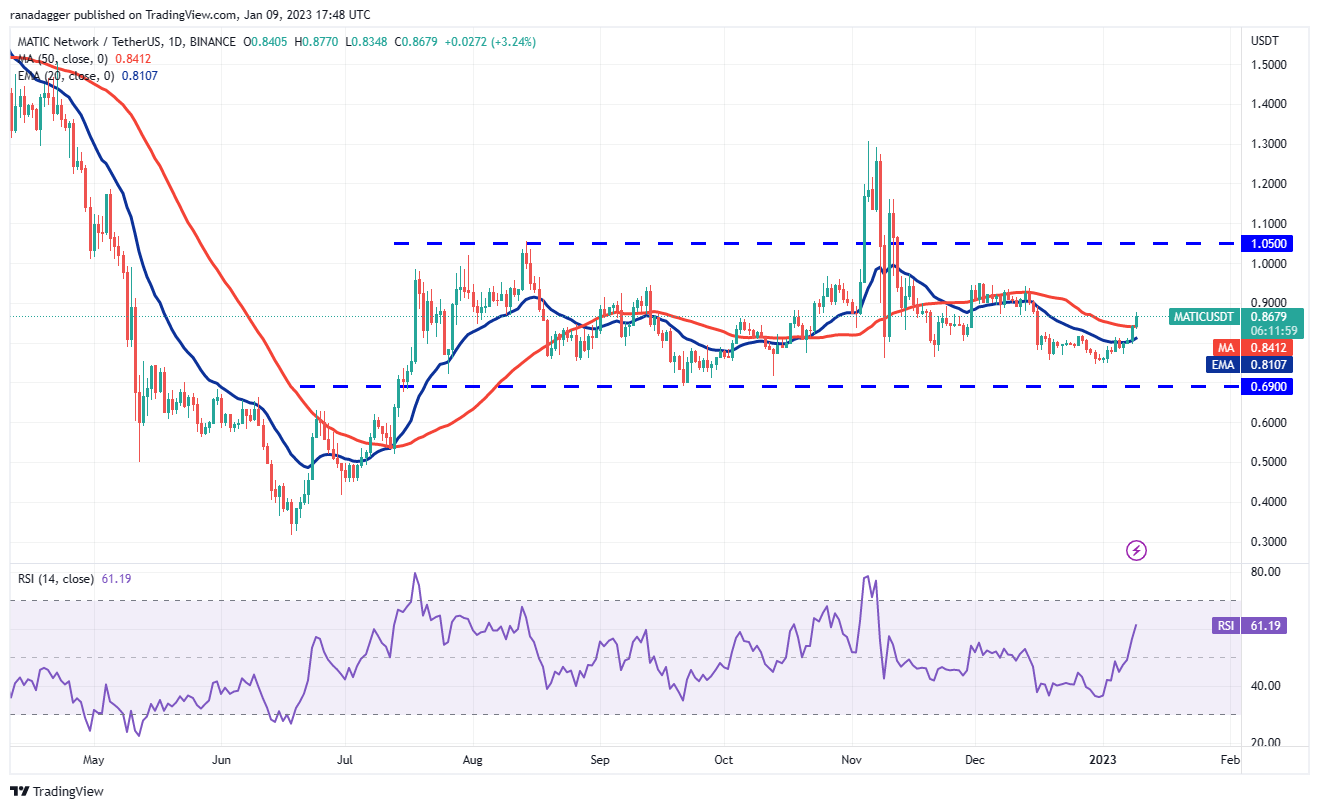
The bulls will try to drive the price to the overhead resistance at $0.97. If the price turns down from this level but rebounds off the moving averages, it will suggest that lower levels are attracting buyers. That could increase the likelihood of a rally to $1.05.
Another possibility is that the price turns down sharply from $0.97 and slumps below the moving averages. Such a move will suggest that the MATIC/USDT pair could consolidate between $0.97 and $0.75 for some more time.
LTC/USDT
Litecoin (LTC) rebounded off the moving averages on Jan. 6 and surged above the overhead resistance at $80 on Jan. 9. The emboldened bulls will try to build upon this momentum and thrust the price above $85.
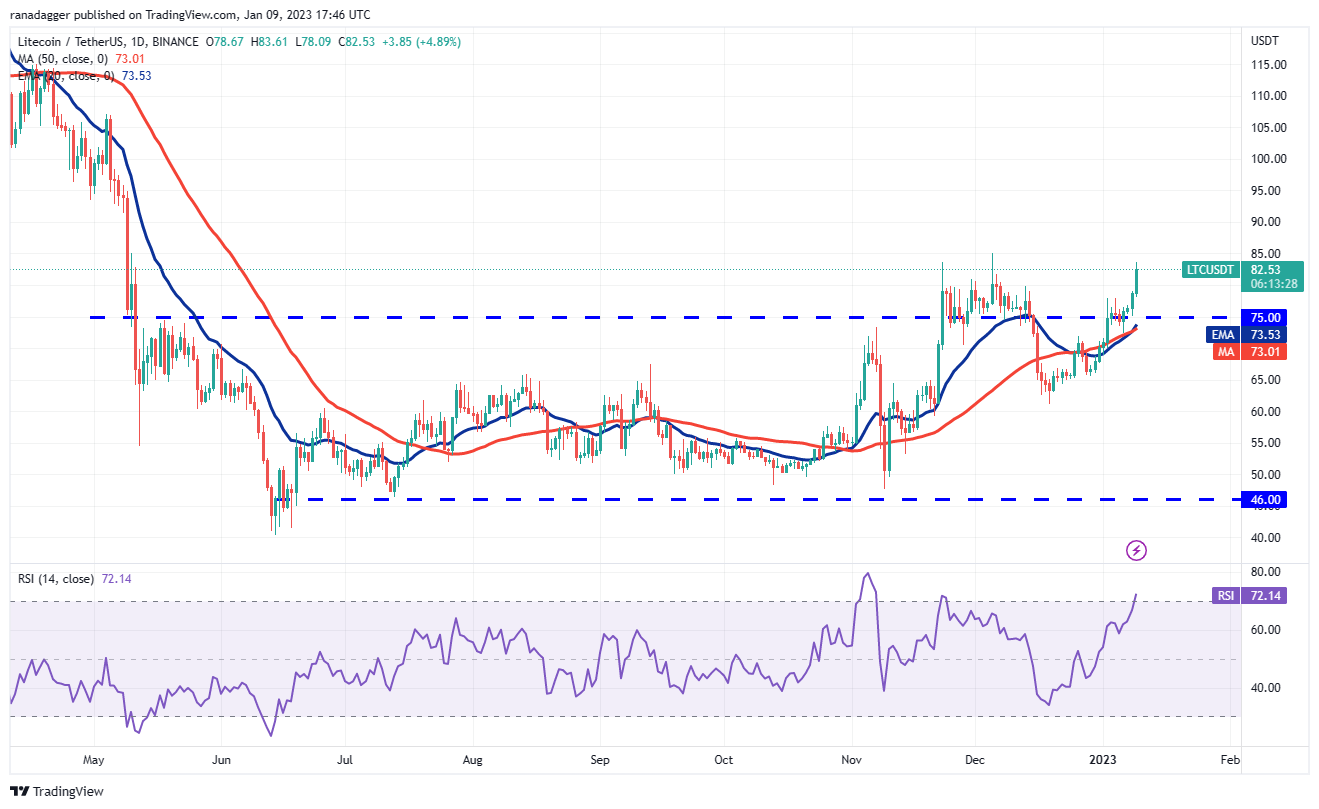
If they manage to do that, the LTC/USDT pair could start a new uptrend. The first target on the upside is $106 and then $115. The upsloping moving averages and the RSI in the overbought territory indicate the path of least resistance is to the upside.
Conversely, if the price turns down from $85, the pair could slip to $75. If the price bounces off this support, the bulls will again try to clear the overhead resistance. The bears will have to drag the price below $72 to gain the upper hand.
The views, thoughts and opinions expressed here are the authors’ alone and do not necessarily reflect or represent the views and opinions of Cointelegraph.
This article does not contain investment advice or recommendations. Every investment and trading move involves risk, and readers should conduct their own research when making a decision.
Go to Source
Author: Rakesh Upadhyay


