fear and greed index

Crypto sentiment index dips back to March ‘fear’ levels amid Binance lawsuit

Total liquidations have topped $280 million in 12 hours on June 5 as crypto market sentiment has turned more fearful.
The Crypto Fear and Greed Index — a tool that measures broader market sentiment towards Bitcoin and the broader crypto market — has dipped to a level of “fear” not witnessed since March 11 this year, when Circle’s USD coin (USDC) briefly lost its dollar-peg.
The stumble in market sentiment on June 5 comes in the wake of the United States Securities and Exchange Commission filing a lawsuit against Binance, its U.S. arm of operations and its CEO, Changpeng Zhao.
The SEC pressed a total of 13 charges against the exchange and its affiliates for failing to register as a securities exchange and operating illegally in the United States.

The index works by aggregating a mixture of indicators to gauge market sentiment. It combines metrics, including price volatility, momentum, trading volume, with data from social media and Google trends to form an overall picture of investor’s emotions toward Bitcoin and the wider crypto market.
Much of the negative sentiment owes to the immediate plunge in the value of cryptocurrencies following the SEC’s latest move against Binance. Blue-chip crypto assets such as Bitcoin and Ether (ETH) are down 4.1% and 3.1%, respectively, in the last 24 hours, according to data from Cointelegraph Price Index.
The larger altcoins also took a beating. At the time of publication, Cardano (ADA) was down 6.4% in the past24 hours, while Solana (SOL) had fallen 7.4%.
Related: SEC complaint hints at why Brian Brooks resigned as Binance.US CEO
Traders with open positions on crypto derivatives markets also suffered consequences, with more than $280 million worth of liquidations occurring since the announcement of the lawsuit.

Unsurprisingly, traders with open “long” positions — a leveraged bet on the price of crypto assets increasing — were the hardest hit, accounting for $261.75 million (92%) of the overall liquidations. Meanwhile, short traders experienced $20.7 million in liquidations. The top two digital assets were responsible for around 43% of these losses.
Asia Express: Yuan stablecoin team arrested, WeChat’s new Bitcoin prices, HK crypto rules
Bitcoin stays out of fear for 11 straight days as price tips near 24K

Bitcoin's huge price surge in January has meant that 64% of Bitcoin investors are in profit, according to data from IntoTheBlock.
Bitcoin (BTC) has just clocked its 11th consecutive day outside the “Fear” zone in the Crypto Fear and Greed Index, cementing its longest streak out of fear since last March.
Bitcoin Fear and Greed Index is 61 - Greed
— Bitcoin Fear and Greed Index (@BitcoinFear) January 30, 2023
Current price: $23,780 pic.twitter.com/U5gxN3AwnT
This comes as Bitcoin hit $23,955 at 8:10 pm UTC time on Jan. 29, its highest level of the year. It has since come back down slightly, to $23,687 at the time of writing.
Meanwhile, Bitcoin sentiment is currently sitting firmly in the “Greed” zone with a score of 61, its highest level since the height of the bull run around Nov. 16, 2021, when its price was about $65,000.

However, despite Bitcoin’s strong resurgence in recent weeks, market participants continue to debate whether the recent price surge is part of a bull trap or whether there is a real chance for a bull run.
Regardless, the current rally has pushed a lot more BTC holders back into the green.
According to data from blockchain intelligence platform IntoTheBlock, 64% of Bitcoin investors are now in profit.
Those who first bought BTC back in 2019 are now — on average — back in profit too, according to on-chain analytics platform Glassnode.
We can calculate the average acquisition price for #Bitcoin by tracking exchange withdrawals.
— glassnode (@glassnode) January 29, 2023
The chart below shows the average withdrawal price for investors for each year.
The average class of 2019+ $BTC is now back in profit (at $21.8k)
Live Chart: https://t.co/yuhvydV70c pic.twitter.com/skjrM6w5lH
The average first-time buy price for BTC investors in 2019 was $21,800, which means those investors are on average up about 9% at the Jan. 29 price of $23,687.
Related: Bitcoin eyes $25K as BTC price nears best weekly close in 5 months
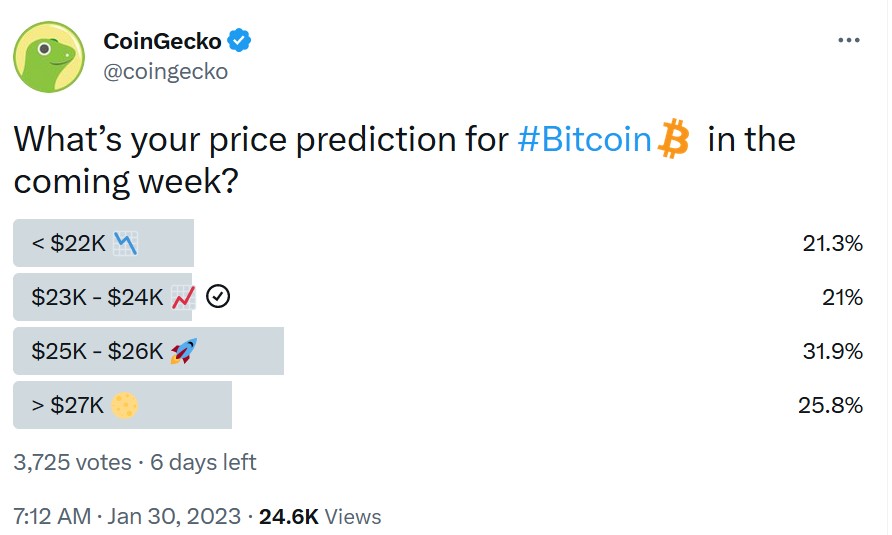
Meanwhile, a Jan. 29 poll from crypto market platform CoinGecko has revealed that 57.7% of 3,725 voters believe BTC will exceed $25,000 this week, while only 21.2% of voters believe BTC is primed for a pullback below $22,000.
The founder and CEO of Vailshire Capital, Dr. Jeff Ross, also provided a technical analysis of his own on Jan. 29, suggesting that a price surge toward $25,000 in the short term may be on the cards:
The strength of #bitcoin on the 4-hour charts continues to be impressive.
— Dr. Jeff Ross (@VailshireCap) January 29, 2023
While price action has trended sideways for over a week, short term indicators (MACD, RSI) have once again reset... and are now ramping higher.
A price surge to ~$25k is probable.
(Not investment advice) pic.twitter.com/QaPbNrxtxZ
Other analysts have called for excited investors to taper some of their expectations, however.
Head analyst Joe Burnett of Bitcoin mining company Blockware told his 43,900 Twitter followers on Jan. 29 that BTC won’t reach and surpass its all-time high of $69,000 until after the next Bitcoin halving event, which is expected to take place in March 2024:
I do not think Bitcoin will make a new all time high until after the 2024 halving.
— Joe Burnett ()³ (@IIICapital) January 29, 2023
Dovish macro conditions and decreased miner sell pressure will lead to the next parabolic bull run.
Using Energy Gravity as a potential top indicator, I expect the next peak to be $150k - $350k. pic.twitter.com/OfCER7s8Zq
Macroeconomist and investment adviser Lyn Alden also recently told Cointelegraph that there may be “considerable danger ahead” with potentially risky liquidity conditions expected to shake the market in the second half of 2023.
Bitcoin price surge: Breakthrough or bull trap? Pundits weigh in

Bitcoin nearly broke its record for the longest streak of daily green price candles this month, but many believe its recent surge could be short-lived.
While Bitcoin (BTC) has experienced a strong price pump to kick off the new year, many industry pundits are not convinced the cryptocurrency will continue its upward trajectory — at least in the short to mid-term.
The impressive price surge — which saw BTC experience 14 days of consecutive price increases earlier this month — has called on many to consider whether the surge marks a significant “breakthrough” or is indicative of a “bull trap."
Speaking to Cointelegraph on Jan. 23, James Edwards, a cryptocurrency analyst at Australian-based fintech firm Finder said the argument for a “bull trap” is stronger, warning the recent surge could be “short-lived.”
He stated that while the BTC price moved upwards over the weekend, the NASDAQ Composite and the S&P 500 also made similar rallies:
"This suggests to me that the rally in crypto is not unique, and instead part of a wider market uplift as inflation figures stall and a risk-on appetite appears to return to investments. So Bitcoin is just enjoying the effects of positive sentiment that originated elsewhere. This is likely to be short-lived.”
Edwards added that cryptocurrency markets still have some “significant hurdles to clear before a new bull market can begin.”
Among those obstacles, he mentioned include the continued fallout over FTX’s collapse and the recent Chapter 11 filing by Genesis on Jan. 19.
"As such, we're going to see further sell-offs and downsizing as crypto firms adjust their balance sheets and dump tokens onto the market to cover debt and try to stay afloat,” he explained.
In a statement to Cointelegraph, Bloomberg Intelligence Senior Commodity Strategist Mike McGlone wasn’t confident in the BTC price trajectory either, citing recessionary-like macroeconomic conditions as too big of a barrier for BTC to overcome.
“With the world leaning into recession and most central banks tightening, I think the macroeconomic ebbing tide is still the primary headwind for Bitcoin and crypto prices.”
The sentiment was also shared among some on Crypto Twitter, with cryptocurrency analyst and swing trader “Capo of Crypto” telling his 710,000 Twitter followers on Jan. 21 that BTC’s push past resistance looks like “the biggest bull trap” he has ever seen:
I've been checking charts all this time, avoiding noise from Twitter. The way the upward movement is happening, the way htf resistances are being tested... it clearly looks manipulated, no real demand.
— il Capo Of Crypto (@CryptoCapo_) January 21, 2023
Once again, the biggest bull trap I've ever seen. But they won't trap me.
However, not all industry pundits were as bearish.
Cryptocurrency market analysis platform IncomeSharks appeared bullish, having shared a “Wall St. Cheat Sheet” chart to its 379,300 Twitter followers on Jan. 22 making a mockery of the “Bears” who think the latest price movements are indicative of a “bull trap.”
#Bears at the Denial stage. "It's just a bull trap" "It's all manipulation". Waiting for the Panic part next... pic.twitter.com/Lo6nWyZPD2
— IncomeSharks (@IncomeSharks) January 22, 2023
Sem Agterberg, the CEO and co-founder of AI-based trading bot CryptoSea also recently shared a flood of posts expressing positive sentiment towards BTC price action to his 431,700 Twitter followers, suggesting that a “BULL FLAG BREAKOUT” towards $25,000 may soon be on the cards:
Meanwhile, others have refrained from making a forecast on the price, likely given the unpredictability of crypto markets.
Here's my technical analysis of where Bitcoin's price is going. pic.twitter.com/cOFueErgGq
— Dan Held (@danheld) January 21, 2023
Related: Bitcoin price consolidation opens the door for APE, MANA, AAVE and FIL to move higher
Bitcoin (BTC) is currently priced at $22,738, while the Bitcoin Fear and Greed Index is currently at “Neutral” with a score of 50 out of 100, according to Alternative.me.
The cryptocurrency managed to break out of the “Fear” zone on Jan. 13 — which was then scored at 31 — after the BTC price increased for seven consecutive days.

Potential Bitcoin price double-bottom could spark BTC rally to $30K despite ‘extreme fear’

The selling pressure in the Bitcoin market is not as bad as it was during the Terra and Three Arrows Capital crises.
Bitcoin’s (BTC) price may climb by more than 50% in September, a month otherwise considered ominous for the cryptocurrency due to its poor historical returns.
BTC price double-bottom and then to $30K?
The conflicting upside signal comes from a potential double-bottom pattern on Bitcoin’s longer-timeframe charts against the United States dollar. Double-bottoms are bullish reversal patterns that resemble the letter W due to two lows and a change in direction from downside to upside.

Bitcoin’s decline below $20,000 in July, followed by a sharp recovery toward $25,000 and a subsequent return to the $20,000 level in August, partially confirms the double-bottom scenario. The cryptocurrency would complete the pattern after rebounding toward $25,000.
A W-shaped price move in an ideal scenario could be followed by another sharp move higher — a double-bottom breakout.
Meanwhile, a double-bottom’s upside target is found after measuring the distance between the pattern’s peak (neckline) and lowest levels and adding the outcome to the breakout point, as illustrated below. In other words, a potential 50% price rally.

As a note of caution, double-bottom setups carry a small degree of failure risks, about 21.45%, according to Samurai Trading Academy’s study of popular charting patterns.
Market slips back into “extreme fear“
Bitcoins bullish reversal scenario occurs amid general price depreciation across the risk-on markets.
Originally, BTC’s descent to $20,000 started after Federal Reserve Chair Jerome Powell reasserted his hawkish stance on inflation at Jackson Hole last week. It further prompted the Bitcoin market sentiment to fall into the “extreme fear” category, according to the popular Fear and Greed index, or F&G.
The market is not enjoying $BTC hanging around $20k. Back into Extreme Fear today.
— Philip Swift (@PositiveCrypto) August 31, 2022
Live chart: https://t.co/Jr5151zN7I pic.twitter.com/UnztrZP7FP
But, to Philip Swift, creator of Bitcoin data source LookIntoBitcoin, the market sentiment is not as fearful as it was in June due to a “huge amount of forced selling” at now-defunct crypto hedge fund Three Arrows Capital and the stablecoin project Terra.
“The F&G score is nowhere near as intensely fearful as it was back when the score dropped to as low as 6; it is currently at 23,” Swift explained, adding:
“There was blind panic back then, whereas we are currently in a period of apathy where people are tired of the bear market and are more interested in their summer holidays and/or the cost of living crisis.”
The statement aligns with Bitcoin investors selling their holdings at a $220 million daily average loss, according to data tracked by Glassnode.
“Investor psychology appears to be one that is keen to simply ‘get my money back,’ with a great degree of spending taking place at and around their cost basis,” the on-chain analytics firm stated in its latest weekly report, adding that the Bitcoin bulls are fighting an uphill battle.
Related: UBS raises US recession odds to 60%, but what does this mean for crypto prices?
That includes whales, entities that hold anywhere between 1,000 and 10,000 BTC. They have been accumulating Bitcoin lately as the price wobbles around $20,000, according to data resource Ecoinometrics.
The whales addresses controlling 1k to 10k BTC are starting to accumulate coins on-chain again.
— ecoinometrics (@ecoinometrics) August 29, 2022
For sure that won't cancel the bear market but apparently some people love #Bitcoin at $20k. pic.twitter.com/7oQmAZ4T5K
“In this bear market, you want to either dollar cost average in a position or straight up buy the dip and wait,” wrote Nick, an analyst at Ecoinometrics.
The views and opinions expressed here are solely those of the author and do not necessarily reflect the views of Cointelegraph.com. Every investment and trading move involves risk, you should conduct your own research when making a decision.
Analysts note parallels with March 2020: Will this time be different?

Analysts across crypto and traditional stocks have taken notice of the similarities between what happened in March 2020 and market moves so far this month.
Analysts in both crypto and traditional markets have noted some startling similarities between the recent downturn and the one caused by a pandemic panic in March, 2020.
The real question is whether it’s the start of a larger downturn or if there will be a significant bounce-back as in 2020 that led to an extended bull run in both crypto and stocks markets.
Podcaster and author of The Pomp Letter, Anthony “Pomp” Pompliano is on the permabull side of the ledger, tweeting on May 18 that since March 1, 2020 when one Bitcoin cost about $8,545, “Bitcoin is up 340%.”
Bitcoin is up 340% since March 1, 2020.
— Pomp (@APompliano) May 17, 2022
As central banks around the world devalued their currencies at a historic rate, there is only one asset that stood out from the pack.#bitcoin is the savings technology that shields billions of people from undisciplined monetary policy.
Among those hopeful of a turnaround is investment firm Real Vision’s CEO Raoul Pal who believes Bitcoin markets have been painting a pattern that shares traits with the March 2020 crash.
In his May 13 episode of Raoul Pal Adventures in Crypto, Pal explained that with the downward price action last week, Bitcoin (BTC) may have “shot straight down” to the bottom of the current wedge formation and is now in a range that will eventually lead to another rise in price. He said,
“That was exactly the kind of pattern we had in March 2020.”
On March 12, 2020, investors panic-sold many assets, including Bitcoin, as fear about how the market would be impacted by the COVID-19 pandemic and global lockdowns. On that day, Bitcoin fell 45% from $7,935 to $5,142 according to CoinGecko.
The current decline in traditional markets has led to a loss of $7.6 trillion in market cap from the tech heavy Nasdaq, in non-inflation adjusted terms, more than the dot-com bubble and the March 2020 sell-offs.
The numbers are obviously not adjusted for inflation but still mind-blowing to see in this context. pic.twitter.com/aHem93mhpo
— Mati Greenspan (@MatiGreenspan) May 17, 2022
The Crypto Fear and Greed Index plunged to 8 on May 17 which is the lowest since March 2020.
#Crypto fear & greed index is at 8 out of 100.
— Michaël van de Poppe (@CryptoMichNL) May 17, 2022
The lowest number since the COVID-19 crash in March 2020. pic.twitter.com/jKVTcjrXV1
The 50 day moving average (MA) of financials, real estate, and technology investments is close to the overwhelmingly oversold levels seen just over two years ago. Respectively, in March 2020 those levels were 0, 0, and 1 compared to 2, 3, and 4 so far in May based on data from Fidelity Investments. In a May 18 tweet, Fidelity’s own Director of Global Macro Jurrien Timmer called March 2020 “one of the most oversold setups in the history of the market.”

Managing partner at The Future Fund Gary Black pointed out on May 17 that Tesla (TSLA) is trading at a 20% discount, the widest from analyst target price since March 2020. He added that “Over the next 12 months, $TSLA rose 660%.”
The last time $TSLA traded at this wide a discount (25%) vs the avg Street PT ($984) was in March 2020, at the height of the Covid crisis. Over the next 12 months, $TSLA rose 660%. Source: https://t.co/5fcVwWX78i pic.twitter.com/z2AHe5zkVi
— Gary Black (@garyblack00) May 16, 2022
The S&P 500 Index also displays similarities as it recorded a 52-week low of 3,930 on May 12 only to bounce back to 4,088 by market close on May 17. Chief Market Strategist for financial research firm LPL Research observed in a May 18 tweet that the last time the index had done that was in March 2020.
The S&P 500 just made a 2% gain in two of the past three days coming off of a 52-week low.
— Ryan Detrick, CMT (@RyanDetrick) May 17, 2022
The last times that happened?
March 2009 and March 2020.
Before traders get too excited, market conditions are very different now, with rising inflation and interest rates. Back then, governments reacted with unprecedented support packages to prop up prices. Reuters reported on May 14 that the strong bounce in the market in 2020 was fueled by what it called an “unprecedented Fed stimulus.”
Analyst and author of the Rekt Capital Newsletter, Rekt Capital tweeted on May 17 that BTC “is entering a period of outsized opportunity” based on analysis of the Log Channel which he says resembles what happened in March 2020. However he’s not clear if we’ve bottomed out yet.
Related: Fear & Greed Index hits lowest since March 2020 even as Bitcoin price hits $30.5K
Last time #BTC lost the Log Channel was in March 2020
— Rekt Capital (@rektcapital) May 16, 2022
This is when $BTC also dipped below the blue 200-SMA
Log Channel clearly shows BTC is entering a period of outsized opportunity
But does price need to drop as low as to the 200-SMA to completely bottom?#Crypto #Bitcoin pic.twitter.com/hTxwfWYdkH
As of the time of writing, Bitcoin is up 1.1% over the past 24 hours trading at $30,545.
Bitcoin whales jumping ship as exchange inflows reach 3-month high

The Bitcoin market appears to be retracing the gains it has made since January as whales may be exiting and selling on centralized exchanges according to Glassnode.
The number of Bitcoin whales is rapidly decreasing to levels not seen since earlier this year, possibly due to the three-month high of coin inflows to centralized exchanges (CEXs).
Bitcoin (BTC) market tracker Glassnode has issued several bearish indicators for the largest cryptocurrency by market cap, including data suggesting a market exit for whales holding at least 1,000 coins, and exchange inflows of more than 1.7 million coins, the most since February.
#Bitcoin $BTC Exchange Inflow Volume (7d MA) just reached a 3-month high of 1,755.021 BTC
— glassnode alerts (@glassnodealerts) May 9, 2022
Previous 3-month high of 1,729.605 BTC was observed on 08 May 2022
View metric:https://t.co/1S6EbDkdOO pic.twitter.com/8kSJPOLJXW
High CEX inflows of BTC suggest whales are potentially exiting the market by selling coins, possibly as a way to prepare for a longer market downtrend. Cointelegraph reported on May 7 that recent sell-offs were likely executed by short-term holders who had accumulated coins in late January and early February when prices had reached a 6-month low of about $34,800.
Unfavorable outlooks on the market based on hard data have led the Bitcoin Fear and Greed Index to drop to 11, the “Extreme Fear” region. The index rates the general amount of fear or greed among Bitcoin investors.
Bitcoin Fear and Greed Index is 11 — Extreme Fear
— Bitcoin Fear and Greed Index (@BitcoinFear) May 9, 2022
Current price: $34,041 pic.twitter.com/PQK3x6YMok
Despite the poor sentiment, BTC daily transactions do not yet appear to have been negatively affected. According to on-chain data from YCharts, there were 233,892 daily transactions worth about $30 billion on May 8, which has been about the average since January.
Lead on-chain analyst at Glassnode “Checkmate” tweeted on Sunday “Many of you are waiting for the Bitcoin ‘capitulation wick’,” partially confirming the notion that investors expect BTC to continue to fall. A capitulation wick is usually characterized by a relatively long, sudden, and catastrophic drop in price, like the one witnessed on March 12, 2020, when BTC dropped 43% in a day to around $4,600.
Many of you are waiting for the #Bitcoin 'capitulation wick'.
— _Checkmate ⚡ (@_Checkmatey_) May 8, 2022
If it happens, and it really is THE capitulation wick, the majority of folks won't step in a buy it because the fear will be too great.
This is the way it always is, and always will be.
Tip: have a plan, stick to it
Related: Bitcoin price target now $29K, trader warns after Terra weathers $285M ‘FUD’ attack
Market analyst Caleb Franzen tweeted to his 11,000 followers on Sunday that investors should look for markets to continue trending downward based on his analysis suggesting we will remain “short-term bearish.” He concluded by stating that it “seems worthwhile to expect more pain.”
BTC is currently down 10.39% over the past seven days, trading at about $33,806 according to Cointelegraph data.
US dollar strength mimics 2020 Coronavirus crash — 5 things to know in Bitcoin this week

USD runs the show behind the scenes as the Easter weekend sparks pain for Bitcoin bulls.
Bitcoin (BTC) starts a new week with all quiet on traditional markets but a storm brewing in crypto.
As the Easter long weekend continues for the United States and much of Europe, traders are keenly eyeing whether Bitcoin can stay stable for four days without professional investor involvement.
So far, the picture has not favored bulls — since Good Friday, BTC/USD has been characterized by sideways action punctuated by episodes of sudden volatility to the downside.
That continued overnight into Monday, and now, $40,000 is once again out of reach. What will the atmosphere be like in the coming days?
Cointelegraph takes a look at the potential market mover factors in line to influence Bitcoin price performance this week.
Holiday cheer costs Bitcoin $40,000
It’s a frustrating time for Bitcoin spot traders. Without traditional market guidance, Bitcoin faces four days of “out-of-hours” trading, meaning that liquidity is thinner than normal.
This has a habit of making any sudden price moves ripple out and cause large than normal knock-on effects.
Should buyer support at a specific price be pulled, for example, panic can set in more easily when there are fewer participants — and less cash — on hand to mitigate it.
Such a scenario has played out several times over the Easter weekend already. While mostly trading sideways, BTC/USD saw episodes of sudden downside from which it struggled to recover.
Overnight on Sunday, the market dived over $1,000 in a matter of minutes, including an $800 loss in a single one-minute candle.
With it came the loss of support at $39,000, data from on-chain monitoring resource Material Indicators confirms.
On Friday, Material Indicators noted the block of buyer support immediately below spot price, this now absent and potentially opening up the possibility of a much deeper retracement to come, involving Bitcoin’s 200-week moving average (200 WMA).
The 200 WMA currently sits at just above $21,000, data from Cointelegraph Markets Pro and TradingView shows. The level is highly significant, never being broken by spot price during bear markets and continually rising throughout Bitcoin’s history.
“50, 100 and 200 Weekly MA are key levels,” Material Indicators meanwhile continued in Twitter comments.
“Bull Markets happen when price is above the 50 WMA. The 100 may give a relief rally, but since 2011 it's never held in a downtrend. The 200 WMA has always marked the bottom + it has confluence with the lifetime support channel.”
The 100 WMA “relief rally” site is at $35,740 as of Monday.

Despite the potentially unreliable holiday price performance, few appeared surprised by the idea that crypto markets en masse are primed for fresh losses.
Popular trader Pierre flagged multiple targets hit across altcoins Monday as BTC wobbled, having previously warned that such a downmove would be the “nail in the coffin” for weak tokens.
Macro has plenty of surprises up its sleeve
With Western markets closed until Tuesday, there is little scope for a macro-induced move on crypto.
Asian markets were mostly flat throughout Monday, with the Hong Kong Hang Seng up a modest 0.67% and the Shanghai Composite Index conversely down 0.67% at the time of writing.
Global financial markets, however, are anything but unremarkable this month, as uncharted territory defines the current setup. Surging inflation coupled with rock-bottom interest rates is one such novel feature.
For markets commentator Holger Zschaepitz, the focus was on the international bonds markets, these having wiped $6.4 trillion off their value since hitting all-time highs last year.
“The biggest bond bubble in 800yrs continues to deflate after rising US inflation data (CPI & PPI) shake up the bond markets. The value of global bonds has dropped by another $400bn this week, bringing total loss from ATH to $6.4tn,” he commented alongside a chart.

Japan’s central bank balance sheet expansion, which Zschaepitz previously called the greatest monetary policy experiment “in history,” is meanwhile delivering fresh phenomena in the form of spiking inflation.
Inflation is a double-edged sword for Bitcoiners, the tide of rising prices and central bank reactions set to put serious pressure on both stocks and risk assets at first. Only later on, various theories argue, will the tide turn in favor of Bitcoin as a store of value.
“The contrast between high equity prices and tame commodities on a 10-year basis may point to greater odds of decreases for stocks,” Bloomberg Intelligence senior commodities strategist Mike McGlone, a proponent of that perspective, wrote in his latest update last week.
“The S&P 500 was up about 280% as of the end of 2021, and our rate-of-change graphic shows the index as a top potential reversion risk vs. the Fed.”
DXY faces "do or die" decision
One yardstick for the traditional economy is meanwhile at what could turn out to be a crucial inflection point.
The U.S. dollar currency index (DXY), a key measure of dollar strength, is facing a choice between continued upside and a major correction as it lingers at the 100 points threshold.

It was a long time coming — the last time that DXY was so bullish was in April 2020 at the height of the coronavirus market shock.
DXY has a habit of running in opposition to Bitcoin price, and while that inverse correlation has broken down to some extent in the past year, the odds remain that a major drawdown for USD would be a benefit to BTC.
“If we see the DXY roll over again at this trendline be prepared for a strong send,” markets commentator Johal Miles summarized Sunday.
“Naturally the FED has key importance here, as any change of course will put pressure on the dollar.”
An accompanying chart highlighted the impact of DXY retracements on BTC/USD since late 2014.

On Monday, however, there were no real signs of a reversal, and a brief dip in DXY last week — which coincided with an equally brief rally in BTC — was soon mitigated entirely.
“Many calling for corrections on DXY but still looking bullish,” popular chartist Jesse Olson added on the day.
Exchange balances lowest since mid-2018
What are the more bullish signals coming from Bitcoin in the current environment?
Look no further than exchanges for one, as their declining balances point to sustained determination to “hodl” BTC.
According to the latest data, not only are buyers continuing to move large tranches of coins off exchanges into cold storage, but those exchanges’ overall BTC balance is now at fresh multi-year lows.
Figures from on-chain analytics firm CyptoQuant confirm that the balance of 21 major exchanges was 2.274 million BTC as of Sunday. The last time that the level was so low was in July 2018.

The impact of such buyer trends has yet to be seen in practice. Despite the available supply declining, a real scramble for BTC has not yet occurred, while sellers have conversely sought to exit at levels approaching $50,000 in recent weeks.
The result is a narrow scope of movement for BTC price action as buyers and sellers act in a closely-guarded range. Ki Young Ju, CEO of CryptoQuant, noted the phenomenon playing out last week.
As Cointelegraph reported, meanwhile, the likely source of the exchange supply sapping is institutional, rather than retail investors.
Crypto sentiment diverges into "extreme fear"
Is crypto market sentiment truly indicative of a shock in the making?
Related: Top 5 cryptocurrencies to watch this week: BTC, XRP, LINK, BCH, FIL
Bitcoin has been praised as the “only” truly honest market available to investors, and its decline from all-time highs thus foreshadowed this year’s inflationary environment hostile to stocks, commodities and more.
Should that hold true, the current state of the Crypto Fear & Greed Index may give investors fresh pause for thought.
At 24/100 as of Monday, the Index is back in its “extreme fear” zone, having more than halved since the start of April.

By contrast, the traditional market Fear & Greed Index is “neutral,” a zone in which it has stayed since exiting the “fear” zone late last month.

While equally famous for its fickle nature, crypto market sentiment could nonetheless be a warning for those hoping that the good times will continue regardless.
The views and opinions expressed here are solely those of the author and do not necessarily reflect the views of Cointelegraph.com. Every investment and trading move involves risk, you should conduct your own research when making a decision.
‘Extreme fear’ as Bitcoin falls below $40K … and then bounces

While many analysts believe Bitcoin is destined for six-figures if support at $40,000 can hold up, others are predicting an imminent bear cycle.
The price of Bitcoin has slumped below $40,000 for the first time in six weeks.
The slide took place near the close of the day on Sept. 21, with BTC prices having drawn down by 16% from nearly $47,300 at the start of the day, to tag a local low of $39,650 at roughly 9pm UTC. The move marked a 25% retracement from BTC’s local highs above $50,000 on Sept. 7.
However, the pullback comes after Bitcoin gained more than 80% since hitting $29,300 on July 20 and then heading into early-September’s highs. Bitcoin has since recovered to trade just above $42,000.
Bitcoin was not alone in suffering a sharp price decline on Sept. 21, with 29 of the top 30 crypto assets by market cap suffering a 24-hour drawdown according to CoinGecko.
According to the crypto Fear & Greed Index, the bearish price action coincides with sentiment of “extreme fear” across the market. Just one month ago, the metric signaled “extreme greed.”
Some of crypto’s outspoken critics have seized on the dip to offer apocalyptic predictions for the markets, with “Mr. Whale” proclaiming to his 300,000 Twitter followers that “the bear market is here.”
The same maxi's who tricked their sheep into buying their Bitcoin bags at $64,000, are now urging them to "buy the dip" and promising a huge rally to $100K.
— Mr. Whale (@CryptoWhale) September 21, 2021
The bear market is here but they will never admit that because they would lose all of their followers!
Notorious gold shill Peter Schiff chimed in, forecasting that the growth of altcoins will soon “overwhelm demand” until “the crypto bubble pops, while Bitfinexed believes the credit woes of Chinese real estate giant Evergrande will threaten Tether’s reserves and the broader crypto markets through systemic risk.
The price plunge also came in the aftermath of SEC chairman Gary Gensler likening stablecoins to poker chips and calling for tightening regulation of the sector.
However, much of Crypto Twitter reports zealous dip-buying in response to the market action, with some analysts asserting Bitcoin is poised for a recovery should prices hold above local support.
Galaxy Digital CEO Mike Novogratz appeared on CNBC to offer that he won’t be feeling “nervous” unless BTC fails to hold above $40,000 and Ether crashes below $2,800. “As long as those [price levels] hold, I think the market’s in good shape,” he added.“
Novogratz is not alone in eying the roughly $40,000 level as a critical support zone for BTC, with popular analyst William Clemente III recently asserting that Bitcoin is unlikely to fall below $39,000 due to its liquid supply floor and “real-time scarcity.”
Related: Ethereum forming a double top? ETH price loses 12.5% amid Evergrande contagion fears
Looking toward the fourth-quarter, influencer Lark Davis notes that the final quarter of both 2013 and 2017 saw rallies of more than 300% respectively as past bull cycles crescendoed, and speculated the possible approval of a Bitcoin exchange-traded fund (ETF) in the United States could again send prices flying.
#bitcoin still going to 100k this year, Q4 2013 and Q4 2017 both saw 300% + rallies.
— Lark Davis (@TheCryptoLark) September 22, 2021
What would make BTC do that again?
A BTC ETF getting approved in the USA.