1. Home
  2. Stellar

Stellar

Stellar Development Foundation invests $15M in Mexico crypto exchange

Airtm is aiming to solve a myriad of financial challenges in Latin America tied to last-mile remittance, affordability and equitable access to the global banking system.

Airtm, a Mexico City-based digital wallet and exchange operator, has received $15 million in funding from the Stellar Development Foundation, or SDF, as it seeks to expand financial services and cryptocurrency adoption in Latin America. 

The investment, which is the largest SDF has ever made as part of its Enterprise Fund, will enable Airtm to integrate with Stellar in the coming year. As part of the Stellar network, Airtm will be able to better provide its users with access to global financial services.

“Airtm exists because financial systems throughout the developing world are not aligned with their people's needs and global aspirations.” said Airtm CEO Ruben Galindo Steckel, adding:

“With this investment, and our integration with the Stellar network, we will continue to advance on our mission of helping consumers and businesses throughout the developing world access stable money that holds its value, is instant to transfer with no fees, compatible with the global economy, and can be withdrawn as local currency whenever, and wherever it’s needed.”

Stellar Development Foundation is a nonprofit organization that leverages blockchain technology to better streamline global financial services. Its Enterprise Fund has invested in several projects this year alone. This includes a $5 million investment in Wyre and a $750,000 allocation to Nigeria-based payment platform Cowrie.

Latin America appears to be a prime focus for SDF, given the continent’s reliance on cash payments. As SDF noted, 91% of all transactions in Mexico are still made in cash as of 2020.

Digital currency adoption appears to be gaining traction in Mexico, with local exchange Bitso becoming the first billion-dollar crypto platform on the continent.

CFTC Reportedly Subpoenas Customer Info from Coinbase Related to Polymarket Probe

More Americans have heard of Dogecoin than Ethereum: Survey

One has introduced smart contracts and is the fabric of decentralized finance, the other is... a meme.

In just over five years since it launched, Ethereum introduced the world to smart contracts, decentralized finance, yield farming and non-fungible tokens, and has long stood just behind Bitcoin as the second-largest blockchain project by market capitalization.

Dogecoin (DOGE) is a meme cryptocurrency which has provided no innovation, has no real raison d'etre, and is only popular because it became the plaything of a famous multi-billionaire during the past 12 months.

So naturally, as one might expect, the average citizen is already more familiar with Dogecoin than they are with Ethereum. That’s according to the results of a survey conducted by Harris Poll, in conjunction with CouponCabin, which asked over 2,000 adults in the United States to give their thoughts on cryptocurrencies.

According to the survey’s findings, 29% of respondents said they were familiar with Dogecoin, compared to just 21% who were familiar with Ethereum.

Of the total 2,063 respondents, 89% said they had already at least heard of cryptocurrency. Bitcoin was already known to a majority (71%) of respondents, with Dogecoin being the second most well-known coin.

Other digital assets that Americans claimed familiarity with included the stablecoin launched by Coinbase and Circle, USD Coin (USDC), of which 21% of respondents said they had knowledge. Some 18% of respondents said they were familiar with Litecoin (LTC), and 10% said Stellar (XLM) was known to them.

When asked whether they believed cryptocurrencies would become the future of money, 31% responded positively, and 30% said they thought of crypto as “innovative.” At the same time, 23% of respondents said they regarded cryptocurrency as a get-quick-rich scheme, while 19% characterized the technology as shady or nefarious. Almost half (44%) of respondents said they’d be open to receiving cryptocurrency as part of an online cashback rewards program.

CFTC Reportedly Subpoenas Customer Info from Coinbase Related to Polymarket Probe

As Bitcoin Drops in Value, Proof-of-Stake Tokens That Use Less Energy See Double-Digit Gains

As Bitcoin Drops in Value, Proof-of-Stake Tokens That Use Less Energy See Double-Digit GainsCrypto markets have been very volatile in recent times and a great number of digital assets have dropped more than 30% in value during the last three days. Although, not all the coins in the crypto economy are doing badly, as coins that do not leverage proof-of-work (PoW) consensus algorithms have actually done well after […]

CFTC Reportedly Subpoenas Customer Info from Coinbase Related to Polymarket Probe

Enterprise blockchain solutions rally as businesses get hip to crypto

XRP, Stellar and XinFin see tremendous growth as enterprise solutions that offer cross-border solutions and serve the unbanked gain traction.

The mainstream adoption of blockchain technology continues to pick up steam as stories like Microstrategy using Bitcoin (BTC) to pay bonuses for its board of directors and Topps announcing plans to release nonfungible token collectible trading cards make headlines on a almost daily basis. 

As more companies and organizations explore what the integration of blockchain technology can do for them, tokens that offer enterprise solutions and provide simple ways for interested parties to explore and use distributed ledger technology have seen triple-digit gains in 2021.

XRP/USDT vs. XLM/USDT vs. XDC/USDT 1-day chart. Source: TradingView

Stellar (XLM), XRP, and XinFin Network (XDC) are three enterprise-focused cryptocurrencies that have seen their prices outperform the field over the past few weeks as global businesses increasingly look to blockchain to help create a simplified and efficient global trade network.

XRP/USDT

XRP is perhaps one of the most well-known crypto projects behind Bitcoin and Ethereum as it has a large group of supporters often referred to as the XRP Army for their willingness to defend the somewhat controversial project.

While growth for XRP in 2021 was initially slowed due to regulatory actions by the U.S. Securities and Exchange Commission which led to the delisting of XRP on multiple cryptocurrency exchanges, its price has surged in the month of April.

XRP/USDT 4-hour chart. Source: TradingView

Trading volume and social activity for XRP picked up significantly in early April when the platform refocused its marketing efforts on promoting how Ripplenet can help create a “more financially inclusive and sustainable future.”

The refocus also included the acquisition of a 40% stake in cross-border payments specialist Tranglo on April 5 and the announcement of a partnership with Mercury FX on April 9. The goal of these partnerships is to help develop an international payments system throughout Africa, and this coincided with the last major spike in the price of XRP.

XLM/USDT

Stellar is an open network that was originally founded in 2014 as a result of a hard fork from the Ripple Labs protocol due to differences in the vision of where the project should be headed.

Over the years its mission has morphed from that of trying to increase inclusion by reaching the world’s unbanked to helping financial firms connect with each other with blockchain technology.

Some of the biggest news for XLM came at the beginning of March with the release of Horizon 2.0:

According to the announcement, Horizon 2.0 created a new way to run the Stellar network infrastructure that "enables large organizations and small developers alike to deploy Horizon with fewer resources, under looser constraints, and with far more flexibility than ever before."

The team also announced partnerships with Velo protocol to help foster international payments in Southeast Asia and with the Cowrie Integrated Systems to help develop payment corridors throughout Africa, with an initial focus on Nigeria.

On April 6, the Stellar Development Foundation’s (SDF) validator nodes temporarily stopped validating transactions on the Stellar network causing concern for community members. According to the SDF, the network remained online during this time as most nodes on the network were still functioning and processing transactions.

XLM/USDT 4-hour chart. Source: TradingView

After an initial pullback in XLM price due to the SDF nodes being taken offline, the reaffirmation in the security and decentralization of the Stellar network led to a quick recovery and breakout to $0.656, its highest level since January 2018.

XDC/USD

A lesser-known enterprise-ready solution that has burst onto the scene in 2021 is XinFin Network (XDC), a hybrid Blockchain technology company optimized for international trade and finance that “combines the power of public & private blockchains with Interoperable smart contracts.”

The XDC protocol utilizes the XinFin Delegated Proof of Stake (XDPoS) consensus mechanism which is designed to create a ‘highly scalable, secure, permissioned, and commercial grade’ blockchain network.

2021 got off to a slow start for XDC due to a hack of the AlphaEX exchange in December 2020 that saw 300 million Ethereum-based XDC (XDCE) stolen and sold on the open market.

A series of steps were taken to mitigate the effects of this hack, which included the burning of 500 million XDCE and the decision to eventually phase out the XDCE contract and focus solely on the XDC token.

XDC/USD 4-hour chart. Source: TradingView

Following the community resolution of the hack, XDC price has exploded to a new all-time high of $0.076 on April 10 thanks to protocol upgrades like the ability to send tokens while offline and a XinFin to Corda bridge that enables XDC to move freely between the Corda Network and XinFin.

XDC also benefited from being listed on multiple exchanges including Liquid Global and Probit, as well as the launch of a regulated index for XinFin digital assets by the regulated index provider Vinter.

As blockchain technology continues its integration into multiple sectors and businesses explore what DLT has to offer, enterprise-focused solutions like XRP, XLM and XDC are well-positioned to see further growth due to the fact that they offer simple solutions that allow people to create and transact cryptocurrencies with minimal effort.

The views and opinions expressed here are solely those of the author and do not necessarily reflect the views of Cointelegraph.com. Every investment and trading move involves risk, you should conduct your own research when making a decision.

CFTC Reportedly Subpoenas Customer Info from Coinbase Related to Polymarket Probe

Price analysis 4/12: BTC, ETH, BNB, XRP, ADA, DOT, UNI, LTC, LINK, XLM

Altcoins continue to press higher while Bitcoin bulls work on holding the $60,000 level as support.

Bloomberg Intelligence senior commodity strategist Mike McGlone equated the current consolidation in Bitcoin (BTC) price to that of a “caged bull, well-rested to escape.” When compared with the rallies a year after the previous two Bitcoin halvings in 2012 and 2016, the strategist called the current price action “tame.’

According to McGlone, Bitcoin is “still in price-discovery mode” and its plateau is still far away.

While Bitcoin remains in focus, altcoins have continued to steal the show. Bitcoin’s market dominance, which stood closer to 70% on Jan. 4 has continued to slide even though its price has risen more than 104% year-to-date. The current market dominance at 54.3% is the lowest since April 2019 according to data from CoinMarketCap. This suggests that several altcoins are outperforming Bitcoin by a large margin.

Daily cryptocurrency market performance. Source: Coin360

However, approval of a Bitcoin exchange-traded fund could tilt the advantage back in favor of Bitcoin. Mike Novogratz’s Galaxy Digital became the latest to file an application with the United States Securities and Exchange Commission for a Bitcoin ETF on Monday. The growing list of candidates applying to launch a Bitcoin ETF shows that there is still huge demand for the digital asset

Will Bitcoin continue to trade sideways while altcoins rally or will it resume its uptrend and lead from the front. Let’s analyze the charts of the top-10 cryptocurrencies to find out.

BTC/USDT

Bitcoin formed an inside day candlestick pattern on April 11, indicating indecision among the bulls and the bears. The bulls tried to resolve this uncertainty to the upside today by piercing the all-time high at $61,825.84, but the bears had other plans. They again successfully defended the overhead resistance.

BTC/USDT daily chart. Source: TradingView

Although the bears are defending the overhead resistance, they have not been able to sink the price further away from $60,000. This suggests the bulls are not closing their long positions in a hurry as they anticipate the uptrend to continue.

If the bulls can drive and sustain the price above $61,825.84, the BTC/USDT pair will complete a bullish inverse head and shoulders pattern. That could result in a rally to the pattern target at $69,540. If the momentum sustains, the next target to watch out for is $79,566.

This bullish view will invalidate if the pair turns down and breaks below the 50-day simple moving average ($54,7823). Such a move could signal the start of a deeper correction.

ETH/USDT

Ether (ETH) has been trading above the breakout level at $2,040.77 for the past three days, but the up-move lacks momentum. The long wick on the April 10 candlestick and the inside day candlestick pattern on April 11 suggests hesitation by the bulls to push the price higher.

ETH/USDT daily chart. Source: TradingView

If the price does not pick up momentum within the next few days, the bears will try to pull the price back below $2,040.77. If the ETH/USDT pair breaks below the 20-day exponential moving average ($1,985), the next stop could be the trendline. A break below this support could signal the start of a deeper correction.

However, the upsloping 20-day EMA and the relative strength index (RSI) above 61 indicate advantage to the bulls. If the bulls punch the price above $2,200 with force, the pair may start the next leg of the uptrend that could reach $2,618.14.

BNB/USDT

Binance Coin (BNB) is in a strong uptrend, but the up-move of the past two days is showing signs of a melt-up. The long wick on today’s candlestick suggests some traders are booking profits at higher levels.

BNB/USDT daily chart. Source: TradingView

Although the 20-day EMA ($385) is sloping up, the RSI above 84 indicates the rally is overheated in the short term. This could result in a minor correction or consolidation for the next few days. In strong uptrends, the corrections generally do not last for more than three days.

The first support on the downside is the 38.2% Fibonacci retracement level at $483.95. If the price rebounds off this support, it will suggest the sentiment remains positive and bulls are buying on dips. They will then try to resume the uptrend by pushing the price above the all-time high at $638.56.

If they succeed, the next leg of the uptrend could begin, which may propel the BNB/USDT pair to $888.70. On the contrary, if bears sink the price below $483.95, the pair could drop to the 20-day EMA.

XRP/USDT

The volatility contraction on April 9 was resolved to the upside on April 10 and XRP rallied above $1.11. The bulls continued their purchase on April 11 and pushed the price to $1.50. However, the long wick on the day’s candlestick suggests traders booked profits at higher levels.

XRP/USDT daily chart. Source: TradingView

The bears could not build up on the advantage today and start a correction. The bulls tried to resume the uptrend but failed, resulting in the formation of a Doji candlestick pattern. This suggests indecision among the bulls and the bears about the next directional move.

If the buyers can propel the price above $1.50, the XRP/USDT pair could rally to $2. Contrary to this assumption, if the price turns down and dips below $1.30, the pair could start a correction.

The major support on the downside is $1.11. If the buyers can flip this level into support, the pair will make one more attempt to rise above $1.50. On the other hand, a break below $1.11 may result in a drop to the 20-day EMA ($0.89).

ADA/USDT

The bulls successfully held Cardano (ADA) above the 50-day SMA ($1.17) in the past few days and are currently attempting to start an up-move. However, the long wick on today’s candlestick suggests that buying dries up above $1.33.

ADA/USDT daily chart. Source: TradingView

If the bulls fail to sustain the price above $1.33, the aggressive bears may again try to sink the price below the 50-day SMA. If they manage to do that, the ADA/USDT pair could drop to the $1.03 to $0.98 support zone.

A rebound off this zone could keep the pair range-bound for a few more days. Alternatively, if the bears sink the price below the zone, the pair could decline to $0.80.

This negative view will invalidate if the pair sustains the price above $1.33. That could push the price to $1.48. A break above this resistance could start the next leg of the uptrend that may reach $2.

DOT/USDT

Polkadot (DOT) has been sandwiched between the 20-day EMA ($39.30) and the overhead resistance at $42.28 for the past few days. However, this tight range trading is unlikely to continue for long.

DOT/USDT daily chart. Source: TradingView

If the bulls can propel the price above $42.28, the DOT/USDT pair could rally to $46.80. The bears may again offer resistance at this level but if the bulls can overcome the barrier the pair could climb up to $53.50 and then $57.

The marginally upsloping 20-day EMA and the RSI above 54 suggest only a minor advantage to the bulls. If the bears can sink the price below the moving averages, it will open the gates for a decline to $32.50 and then $26.50.

UNI/USDT

Uniswap (UNI) has soared above the all-time high at $36.80 today. Although the moving averages are yet to turn up, the RSI has risen close to the overbought territory, indicating a pick-up in momentum.

UNI/USDT daily chart. Source: TradingView

If the bulls can sustain the price above $35.20, it will suggest strong demand at higher levels. The UNI/USDT pair could then march up to $43.43 and if this level also gets taken out, the up-move may hit $50.

Contrary to this assumption, if the bulls fail to sustain the price above $35.20, it will suggest that traders are booking profits at higher levels. If the price dips and sustains below $35.20, the range-bound action in the pair could continue.

LTC/USDT

Litecoin’s (LTC) volatility contraction on April 8 and 9 was followed by an expansion in favor of the bulls. The buyers pushed the price above $246.96 on April 10 and have successfully managed to sustain the price above it since then.

LTC/USDT daily chart. Source: TradingView

The upsloping 20-day EMA ($218) and the RSI above 63 suggest the path of least resistance is to the upside. If the buyers can drive the price above $262.93, the LTC/USDT pair could rally to its next target objective at $307.42.

This bullish view will invalidate if the price breaks and sustains below $246.96. Such a move will suggest that traders booked profits at higher levels. The critical support to watch on the downside is the 20-day EMA.

A strong bounce off it will suggest the sentiment remains positive and the bulls will once again try to resume the uptrend. Conversely, a break below the 20-day EMA could pull the price down to $170.

LINK/USDT

Chainlink (LINK) is stuck between $24 and $36.93. The marginally rising 20-day EMA ($30.92) and the RSI above 55 suggest the bulls have a slight edge. However, the failure of the bulls to challenge the $36.93 overhead resistance indicates that demand dries up at higher levels.

LINK/USDT daily chart. Source: TradingView

The bears are currently trying to sink the price below the $32 support. If they can accomplish that, the possibility of a break below the moving averages increases. Such a move could pull the price down to $24.

Contrary to this assumption, if the price bounces off the 20-day EMA, the bulls will make one more attempt to drive the price above $36.93. If they succeed, the LINK/USDT pair could resume its uptrend and rally toward $40 and then $50.

XLM/USDT

The bulls are attempting to resume the uptrend in Stellar Lumens (XLM) but they are facing stiff resistance at the $0.60 level. The bulls pushed the price above the overhead resistance on April 11 and today but they could not sustain the breakout.

XLM/USDT daily chart. Source: TradingView

If the bulls do not allow the price to slip below $0.55, it will suggest accumulation on dips. The upsloping 20-day EMA ($0.47) and the RSI near the overbought territory suggest the bulls are in control.

A breakout and close above $0.60 will be the first sign that bulls have overpowered the bears. If that happens, the XLM/USDT pair could resume the uptrend and rally to $0.72 and then $0.85.

On the other hand, if the bears sink the price below $0.55, the pair could drop to the 20-day EMA.

The views and opinions expressed here are solely those of the author and do not necessarily reflect the views of Cointelegraph. Every investment and trading move involves risk. You should conduct your own research when making a decision.

Market data is provided by HitBTC exchange.

CFTC Reportedly Subpoenas Customer Info from Coinbase Related to Polymarket Probe

Stellar Primed to Break Out as Institutions Buy XLM en Masse

Stellar entered a new uptrend that has seen it rise over 60% since the beginning of the month. While institutional investors continue scooping up more XLM, prices look poised to break out.  

Institutional Demand Skyrockets

Institutional demand for XLM seems to be picking up at an exponential rate. Although a recent technical glitch caused core validators to drop off the Stellar network momentarily, investors have not been discouraged from getting a piece of this altcoin. 

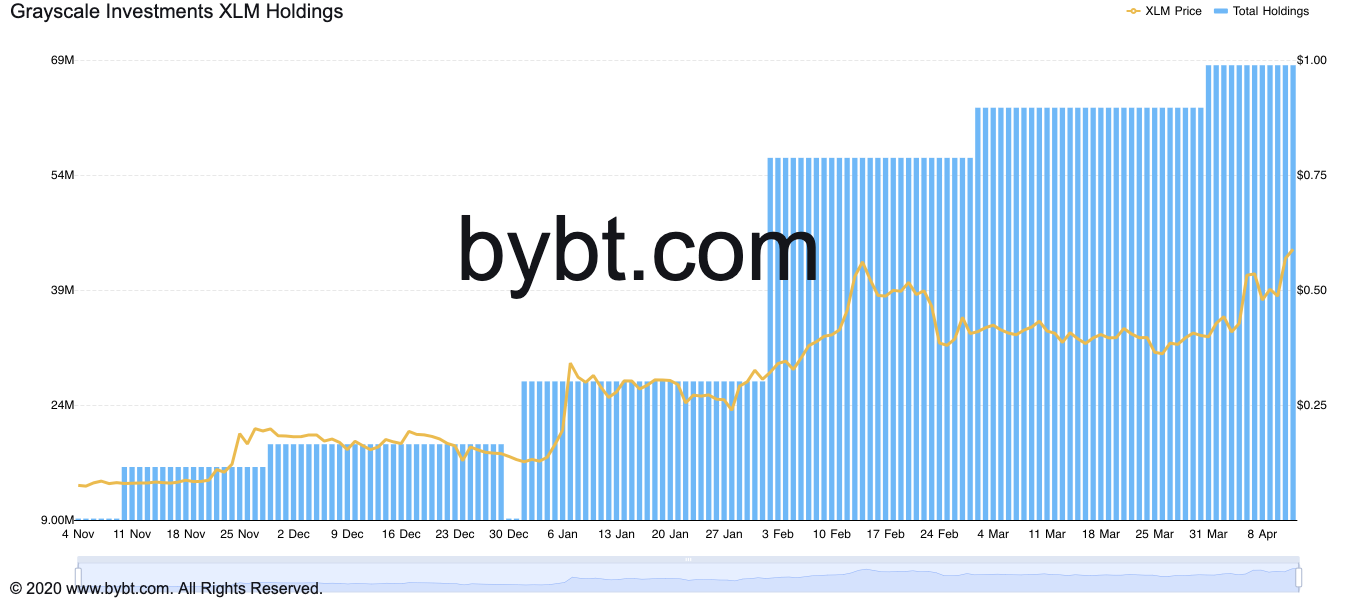
Data from Bybt shows that Grayscale has gone on a buying spree, adding more upward pressure to the cross-border remittances token. The world’s largest cryptocurrency asset management firm has raked 5,566,271 XLM over the past month, worth roughly $2.5 million.

Stellar Primed to Break Out as Institutions Buy XLM en Masse
Grayscale XLM Holdings by Bybt

As institutional investors gain exposure to Stellar, prices have responded strongly. Since the beginning of the month, XLM’s market value has risen by nearly 60%, going from a low of $0.41 to make a new-yearly high of $0.66. 

XLM Targets New Yearly Highs

Despite the significant gains already incurred, the eleventh-largest cryptocurrency by market cap seems to have more room to grow. 

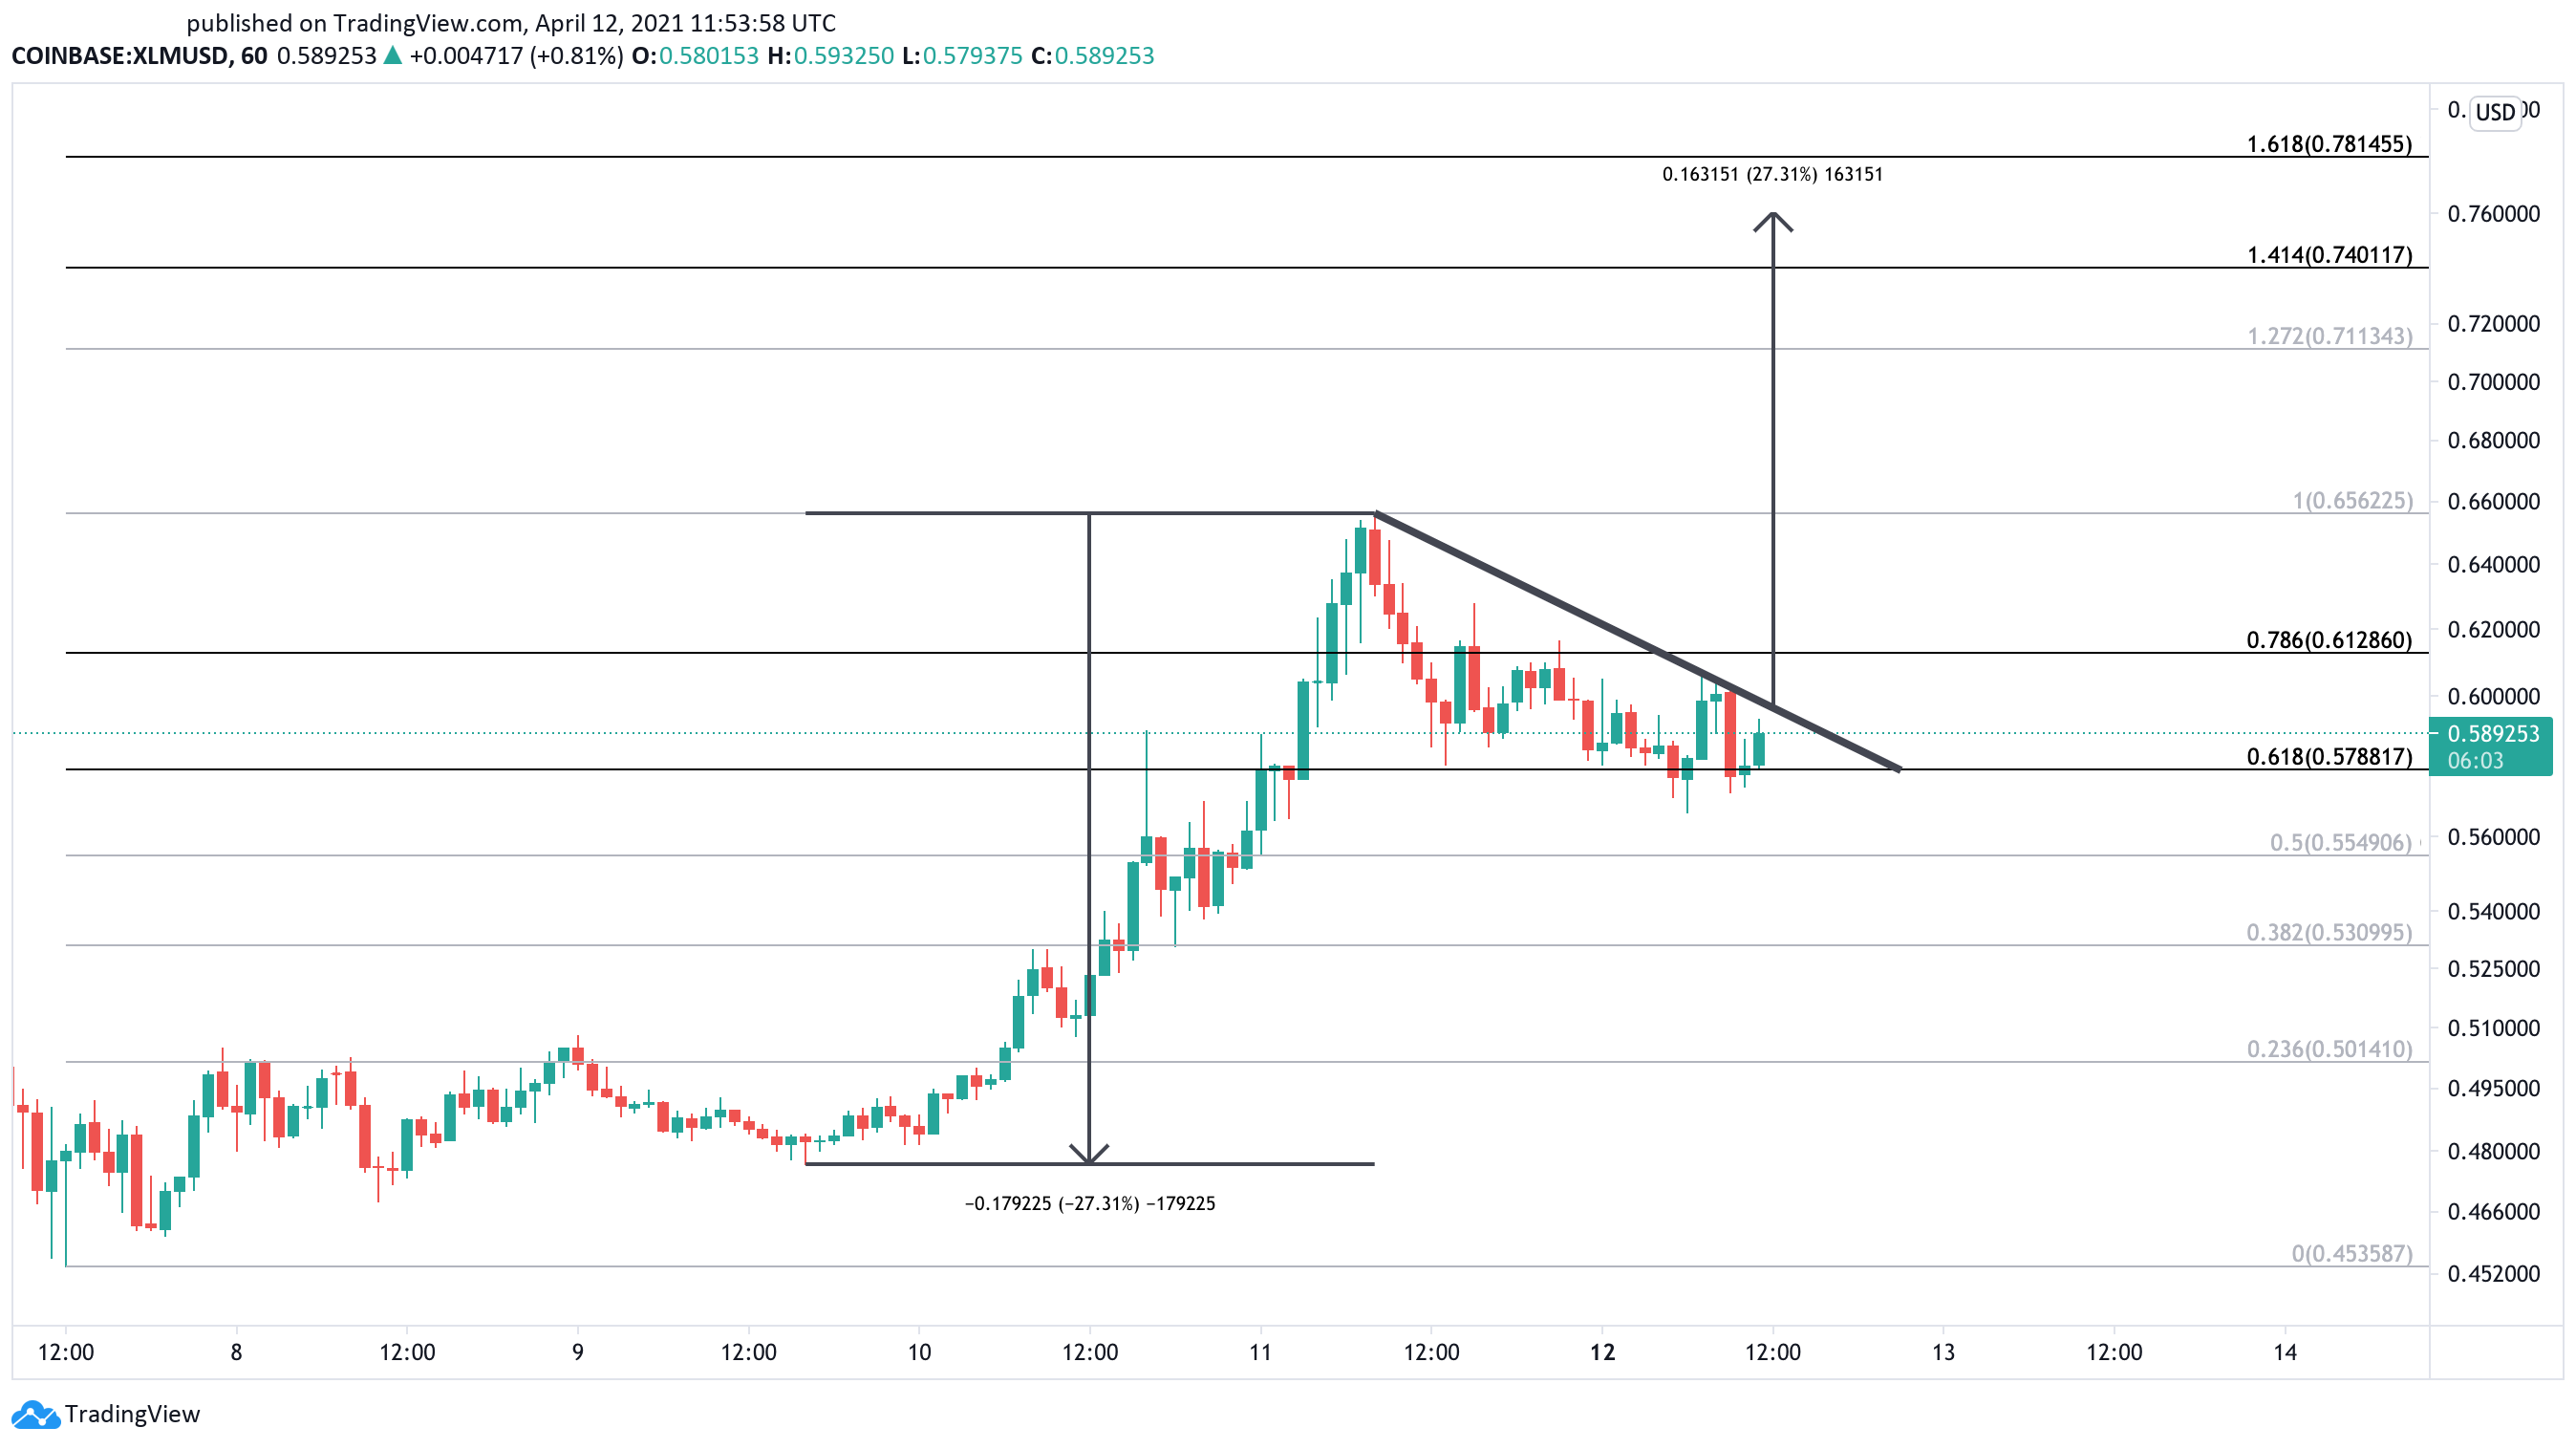
XLM appears to have entered a consolidation phase on the 1-hour chart after its peak on Apr. 11. The short-term lackluster price action seen over the last 28 hours seems to be creating the pennant of a bull pennant formation. Meanwhile, the 37.60% upswing seen since Apr. 9 appears to have developed the pattern’s flagpole. 

Another spike in buying pressure around the current price levels in which Stellar slices through the pennant’s upper trendline or the 78.6% Fibonacci retracement level at $0.61 will signal a potential breakout. 

If this were to happen, XLM’s price could surge by nearly 30% towards the 141.4% or 161.8% Fibonacci retracement level. These resistance barriers sit at $0.74 and $0.78, respectively.

Such an optimistic target is determined by measuring the flagpole’s height and adding that distance to the breakout point.

Stellar US dollar price chart
XLM/USD on TradingView

Even though the odds seem to favor the bulls, XLM perpetual swaps’ funding rates are at unsustainable levels

Funding rates of 0.1% or higher every eight hours suggest that market participants have entered a state of euphoria, leading to steep corrections.

At the time of writing, XLM’s funding rate is hovering at 0.2308% on Binance, 0.1320% on FTX, 0.2513% on Huobi, and 0.1380% on OKEx.

Stellar perpetual swaps' funding rates
XLM Funding Rates by ViewBase

Given the levels of greed in the cryptocurrency market, investors must note that XRP needs to hold above the 61.8% Fibonacci retracement level at $0.58 for the bullish outlook to prevail.

Failing to do so could lead to a correction to the 38.2% or the 23.6% Fibonacci retracement level. These support levels sit at $0.53 and $0.50, respectively. 

Disclosure: At the time of writing, this author owned Bitcoin and Ethereum.

CFTC Reportedly Subpoenas Customer Info from Coinbase Related to Polymarket Probe

Top 5 cryptocurrencies to watch this week: BTC, XLM, MIOTA, XMR, XTZ

Traders appear to be waiting for a trigger to start the next leg of Bitcoin's uptrend and if that happens, XLM, MIOTA, XMR and XTZ could join the party.

Bitcoin’s (BTC) hesitation near the all-time high suggests that the bulls and the bears are waiting for a trigger to start the next trending move.

The bulls are searching for a positive catalyst to thrust the price above the overhead resistance. On the contrary, the bears may be standing by in anticipation of any signs of weakness that could confirm a short-term top.

The event that may act as a trigger is the Nasdaq listing for Coinbase's COIN stock on April 14. A successful listing is likely to be cheered by the crypto bulls because that could signal increased crypto adoption by traditional investors in the future. Conversely, a tepid reception to the Coinbase listing could embolden the bears.

Crypto market data daily view. Source: Coin360

Onchain indicator HODL waves suggests that both the long-term investors and the short-term speculators are not booking profits as they expect higher levels in the future. An increase in the number of HODLers is generally a bullish sign but could become an overhang if fresh money dries up and the market starts to reverse direction.

If that happens, the short-term speculators are likely to panic first and dump their positions. That may hit stops of the swing traders and intensify the selling, paving way for a deeper correction.

As markets wait for a trigger, let’s analyze the charts of the top-5 cryptocurrencies that could benefit from a bullish sentiment.

BTC/USDT

Bitcoin soared above the $60,000 overhead resistance on April 10 and reached $61,301.21, just short of the all-time high at $61,825.84. However, the bulls continue to find difficulty in keeping the price above $60,000, indicating stiff resistance from the bears.

BTC/USDT daily chart. Source: TradingView

The price has yet to close above $60,000 which means the inverse head and shoulders pattern is still not complete.

The bears will try to capitalize on the small window of opportunity and pull the price down to the 20-day exponential moving average ($57,513). A strong bounce off this support will increase the possibility of a break above $61,825.84.

If that happens, the BTC/USDT pair could start the next leg of the uptrend that could push the price to $69,540 and then $79,566.

On the other hand, if the bears sink the price below the 20-day EMA, the pair could challenge the critical support at the 50-day simple moving average ($54,723). A break below this support will be the first indication of a possible change in trend.

BTC/USDT 4-hour chart. Source: TradingView

The 4-hour chart shows the bears are active above $60,000. However, the positive sign is that the bulls have not allowed the price to sustain below the 20-EMA. This means the bulls are buying on every minor dip.

If the bulls can once again push the price above $60,000, the pair may challenge the all-time high. On the contrary, if the bears sink the price below the 20-EMA, a drop to $57,600 is possible. If this support cracks, the next stop could be $55,600.

XLM/USDT

Stellar Lumens (XLM) broke above the $0.60 resistance today and rose to a new 52-week high at $0.65. Whenever an asset hits a new 52-week high, it is a sign of strength because it shows that traders are in a hurry to buy as they expect the price to rise further.

XLM/USDT daily chart. Source: TradingView

The upsloping 20-day EMA ($0.46) and the relative strength index (RSI) in the overbought territory suggest the bulls have the upper hand. If the bulls can propel the price above $0.65, the XLM/USDT pair could start the next leg of the uptrend that could reach $0.72 and then $0.85.

However, the long wick on today’s candlestick suggests that the bears have other plans. They are trying to trap the aggressive bulls and pull the price back below $0.60. If the bulls do not allow the price to dip below $0.55, it will suggest accumulation on dips. That will keep the sentiment positive.

Contrary to this assumption, if the bears sink the price below $0.55, a drop to the 20-day EMA is possible. A break below this support will indicate that the bulls have lost their grip.

XLM/USDT 4-hour chart. Source: TradingView

The 4-hour chart shows the pair closed above $0.60 but the bulls could not build upon this strength. The bears pounced on the opportunity and have pulled the price back below the breakout level at $0.60.

However, if the bears fail to sink the price to the 20-EMA, it will suggest the bulls are accumulating on dips. That will increase the possibility of the resumption of the up-move. Conversely, a break below the 20-day EMA may tilt the advantage in favor of the bears.

MIOTA/USDT

IOTA (MIOTA) is in an uptrend. The bulls pushed the price above the psychologically important level at $2 on April 10. If bulls can sustain the breakout, the up-move could reach the next target objective at $2.35 and then $2.60.

MIOTA/USDT daily chart. Source: TradingView

The upsloping 20-day EMA ($1.66) and the RSI near the overbought zone suggest the bulls have the upper hand.

However, if the bulls fail to sustain the price above $2, the bears may try to pull the price down to the 20-day EMA. The bulls have successfully defended this support since the start of the current leg of the rally in March.

Hence, if the price again rebounds off the 20-day EMA, it will suggest the sentiment remains positive and the bulls are buying on dips. Alternatively, a break below the 20-day EMA will suggest that the bears are making a comeback.

MIOTA/USDT 4-hour chart. Source: TradingView

The 4-hour chart shows profit-booking above $2. The MIOTA/USDT pair could now drop to the 20-EMA, which is sloping up. If the price rebounds off this level, it will enhance the prospects of the resumption of the uptrend.

On the contrary, if the bears sink the price below the 20-EMA, the pair could extend its decline to the 50-SMA. Such a deep correction could delay the start of the next leg of the up-move.

XMR/USDT

Monero (XMR) broke above the $268.60 resistance on April 10, indicating the possible resumption of the uptrend. If the bulls can sustain the breakout, the altcoin could rally to the next target objective at $334 and then $384.

XMR/USDT daily chart. Source: TradingView

The rising 20-day EMA ($258) and the RSI above 75 suggest the path of least resistance is to the upside.

However, if the bulls fail to sustain the price above $288.60, the XMR/USDT pair could drop to the 20-day EMA. A strong bounce off this support will suggest the sentiment remains positive and the bulls are buying on dips. The bulls will then make one more attempt to resume the uptrend.

On the other hand, if the bears sink the price below the 20-day EMA, it will suggest a possible change in sentiment. That could result in a drop to the 50-day SMA ($232).

XMR/USDT 4-hour chart. Source: TradingView

The 4-hour chart shows the bears attempted to stall the rally near the psychological resistance at $300 but the bulls did not give up much ground. They purchased the dip to the 20-EMA and pushed the price above $300.

The rising moving averages and the RSI near the overbought zone suggest the bulls are in control.

This positive view will invalidate if the price turns down and breaks below the moving averages. Such a move will indicate the demand has dried up and traders are booking profits. That could pull the price down to $250.

XTZ/USDT

Tezos (XTZ) is in a strong uptrend. It broke above the stiff overhead resistance at $5.64 on April 5 and completed a successful retest of the breakout level on April 7 and 8. The altcoin resumed its uptrend and made a new all-time high at $7.21 on April 10.

XTZ/USDT daily chart. Source: TradingView

The 20-day EMA ($5.42) is sloping up and the RSI is near the overbought territory, indicating advantage to the bulls. In a strong uptrend, corrections usually last between one to three days as traders buy every minor dip aggressively.

The long tail on today’s candlestick suggests traders are buying at lower levels. If they can drive the price above $7.21, the XTZ/USDT pair could rally to the next target objective at $8.14.

The major support on the downside is the 20-day EMA. If the price rebounds off this support, it will suggest the sentiment remains bullish. The buyers will then again try to push the price above $7.21. Conversely, a break below the 20-day EMA will suggest the bullish momentum has weakened.

XTZ/USDT 4-hour chart. Source: TradingView

The 4-hour chart shows the bulls are trying to arrest the pullback at the 20-EMA. If they can push the price above $6.85, a retest of $7.21 is possible. A breakout of this resistance will start the next leg of the up-move.

Contrary to this assumption, if the pair breaks and sustains below the 20-EMA, it may drop to the 50-SMA. The bulls are likely to defend this support aggressively because the price has not dipped below the 50-SMA since March 29.

However, if the bulls fail to arrest the decline at the 50-SMA, the slide could extend to $5.40 and then to $4.60.

The views and opinions expressed here are solely those of the author and do not necessarily reflect the views of Cointelegraph. Every investment and trading move involves risk, you should conduct your own research when making a decision.

CFTC Reportedly Subpoenas Customer Info from Coinbase Related to Polymarket Probe

Stellar Blockchain Faces Outage as Some Validators Go Offline

The Stellar blockchain is currently facing a serious network outage due to an unknown bug.

Bitstamp Halts Stellar XLM

According to Stellar’s official update, an unknown technical glitch has caused some important validators to drop off the network.

As of 13:26 UTC, Stellar Development Fund (SDF) engineers are busy investigating the technical issues that caused the validators to drop off.

As validators are currently offline, the blockchain is unable to process new blocks.

The block explorer shows that the network processed its last transaction six hours ago.

“At this moment, we are unable to provide ETA for a fix,” the update says.

Meanwhile, crypto exchange Bitstamp has temporarily halted deposits and withdrawals of XLM, Stellar’s native token, due to ongoing issues.

Since the outage news, its token price has taken a hit, coming all the way from ~$0.57 to ~0.49 at press time.

The incident has been unprecedented for Stellar–a blockchain worth $11 billion that hosts several crypto projects, including the second-largest stablecoin USD Coin (USDC).

Blockchains depend on complex encryption and continuous sync among validators to keep the network running; Stellar is no different. However, small software bugs may cause sporadic disruptions.

In December 2020, Solana, a proof-of-stake blockchain, faced an outage as an unknown software error prevented validators from confirming new blocks.

Note: This is a developing story and will be updated with new information.

CFTC Reportedly Subpoenas Customer Info from Coinbase Related to Polymarket Probe