
BTC price breakout by end of August? 5 things to know in Bitcoin this week

Bitcoin stays frustratingly quiet after the weekly close, but BTC price forecasts are giving ever-shorter breakout deadlines.
Bitcoin (BTC) is painting a classic August picture as it starts the new week — volatility is nowhere to be seen.
In a continuation of some of the quietest BTC price action ever seen, the largest cryptocurrency remains locked in a narrow trading range below $30,000.
Whether it be long or short timeframes, Bitcoin is giving market observers cause for increasing frustration. Despite a tug-of-war between bulls and bears on exchanges, neither party seems able to set a new BTC price trend in motion.
Will the status quo remain this week?
With few macroeconomic triggers in store, catalysts for change will need to come from elsewhere. Whales are accumulating, data suggests, fueling an argument that Bitcoin is preparing its next major breakout phase in classic style.
A similar conclusion comes from some of the narrowest volatility recorded for Bitcoin courtesy of the Bollinger Bands metric, with current conditions rivalling September 2016 and January 2023.
By definition, it may simply be a matter of time before history repeats itself.
Bitcoin copycat move begins new rangebound week
The weekly close saw a modicum of volatility return to Bitcoin spot price performance, but just like last week, this was short lived.
Following the new weekly candle open, BTC/USD dipped to test $29,000 before returning to its previous position — one that still holds at the time of writing, data from Cointelegraph Markets Pro and TradingView shows.
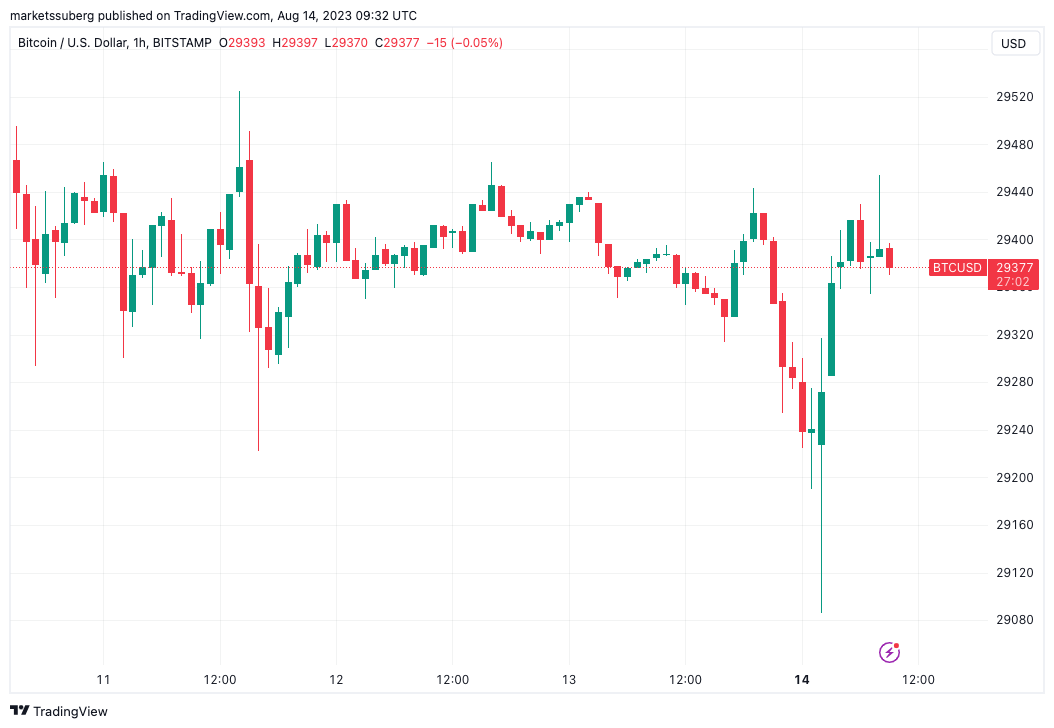
Michaël van de Poppe, founder and CEO of trading firm Eight, noted the similarities while repeating his view that $29,700 is the level for bulls to reclaim.
Over the weekend, Van de Poppe described the lack of volatility overall as “extremely astonishing.”
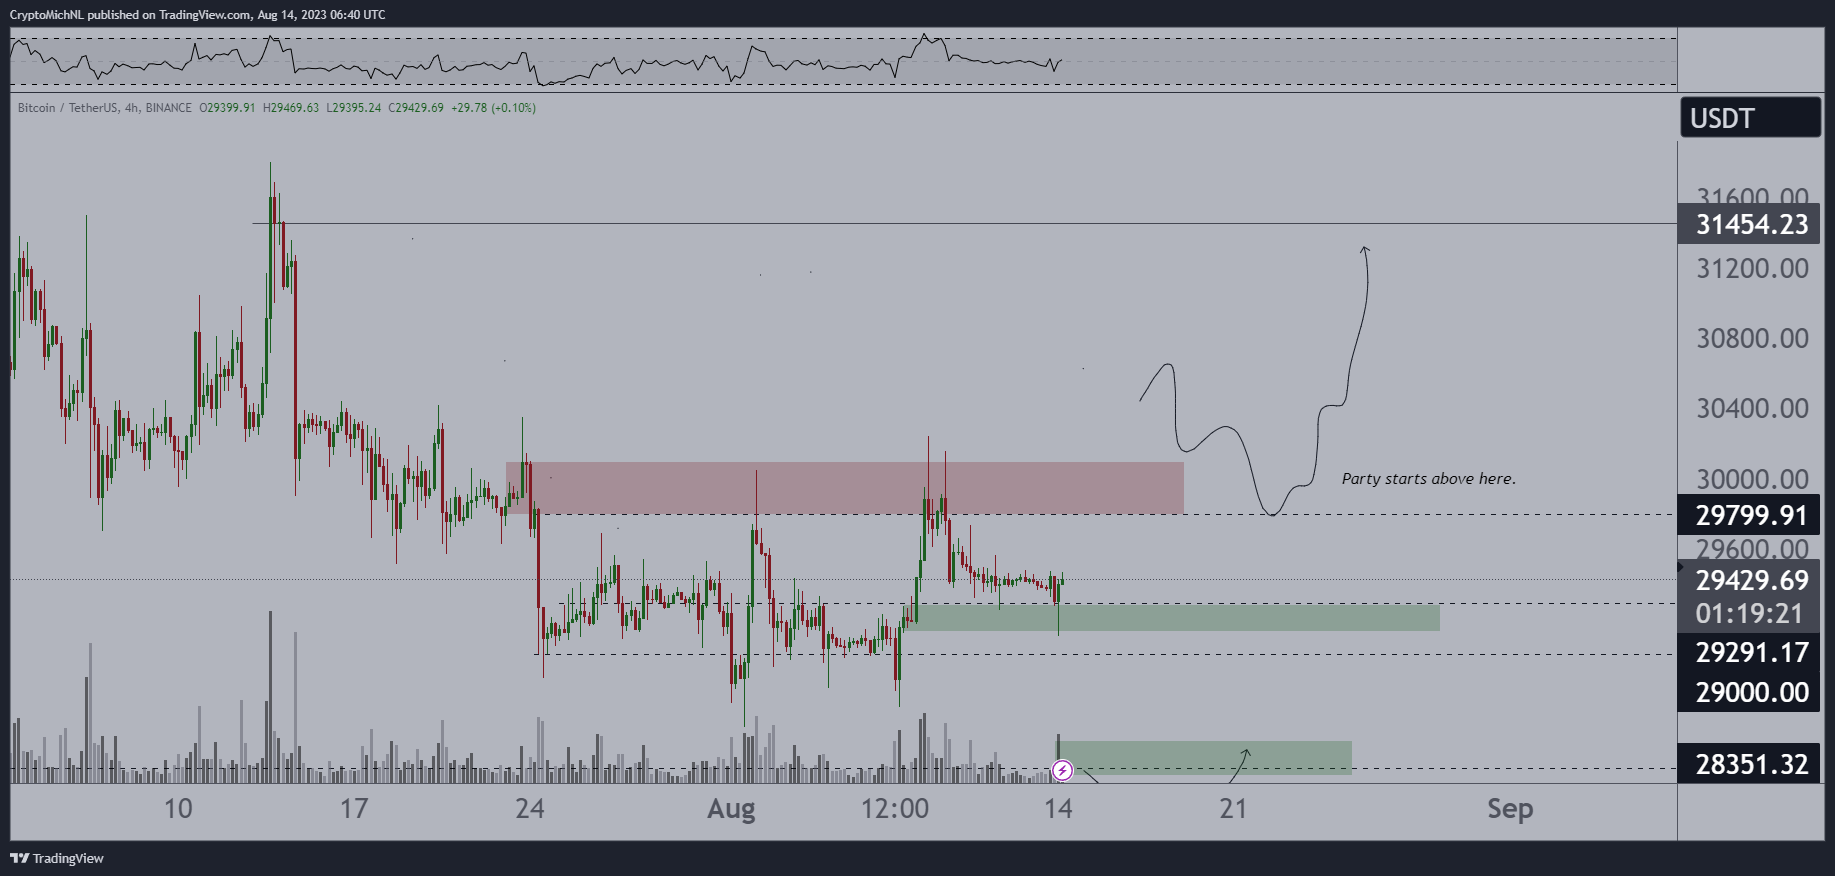
“The classic dump on Sunday evening took place on Bitcoin,” he told X subscribers alongside a chart showing relevant areas of interest.
“Holding onto support, all good. Continue the range. Party starts above $29,700.”
Popular trader Daan Crypto Trades held a similar opinion on short-term movements, noting that even weekend conditions were trending toward unusually calm extremes.
“Dancing around the CME Close price as expected. It’s been a long time since we’ve seen anything different,” he summarized.
“Volatility this time around was extremely low. Even for a weekend.”
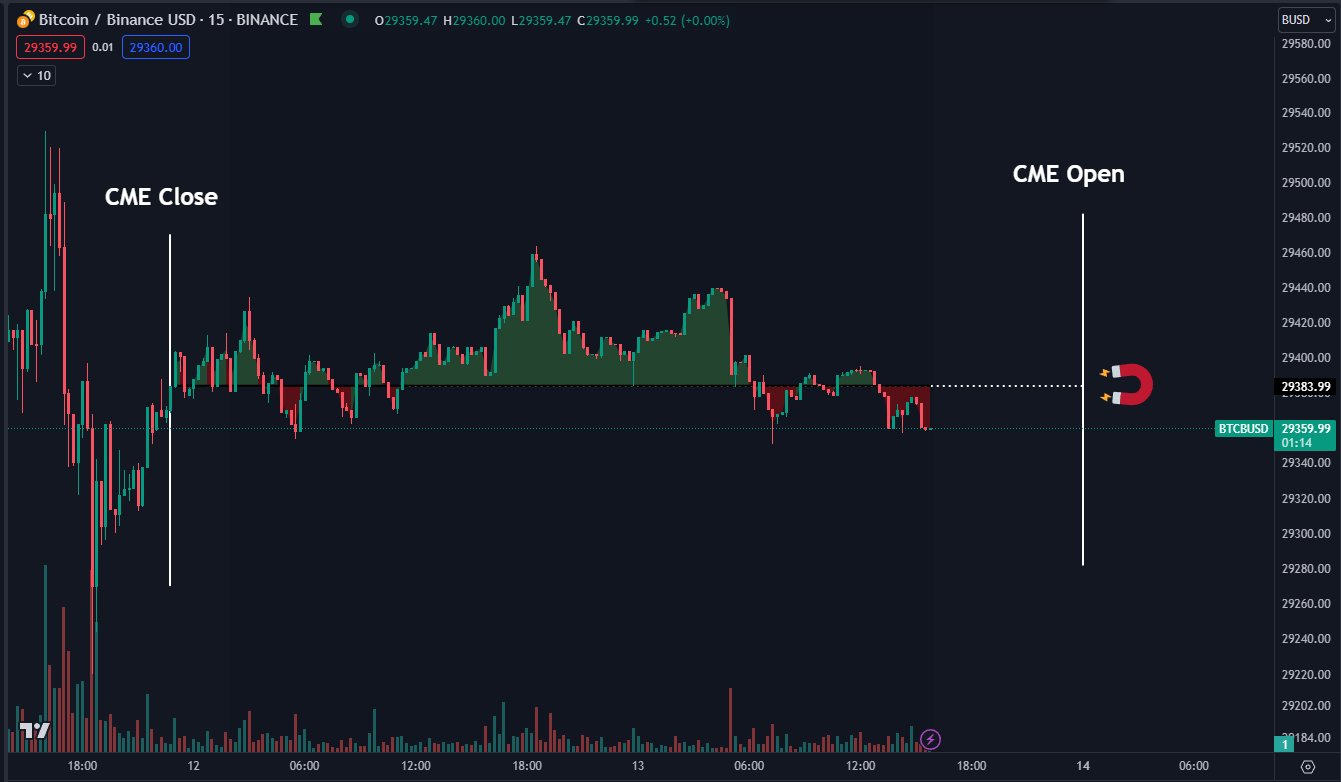
An accompanying chart put the CME Bitcoin futures closing price for the week prior at $29,465 as the focal point for the start of the week.
Weekly close clinches key BTC pric level
The weekly close itself nonetheless did manage to offer a glimmer of hope for those analyzing longer-term trends.
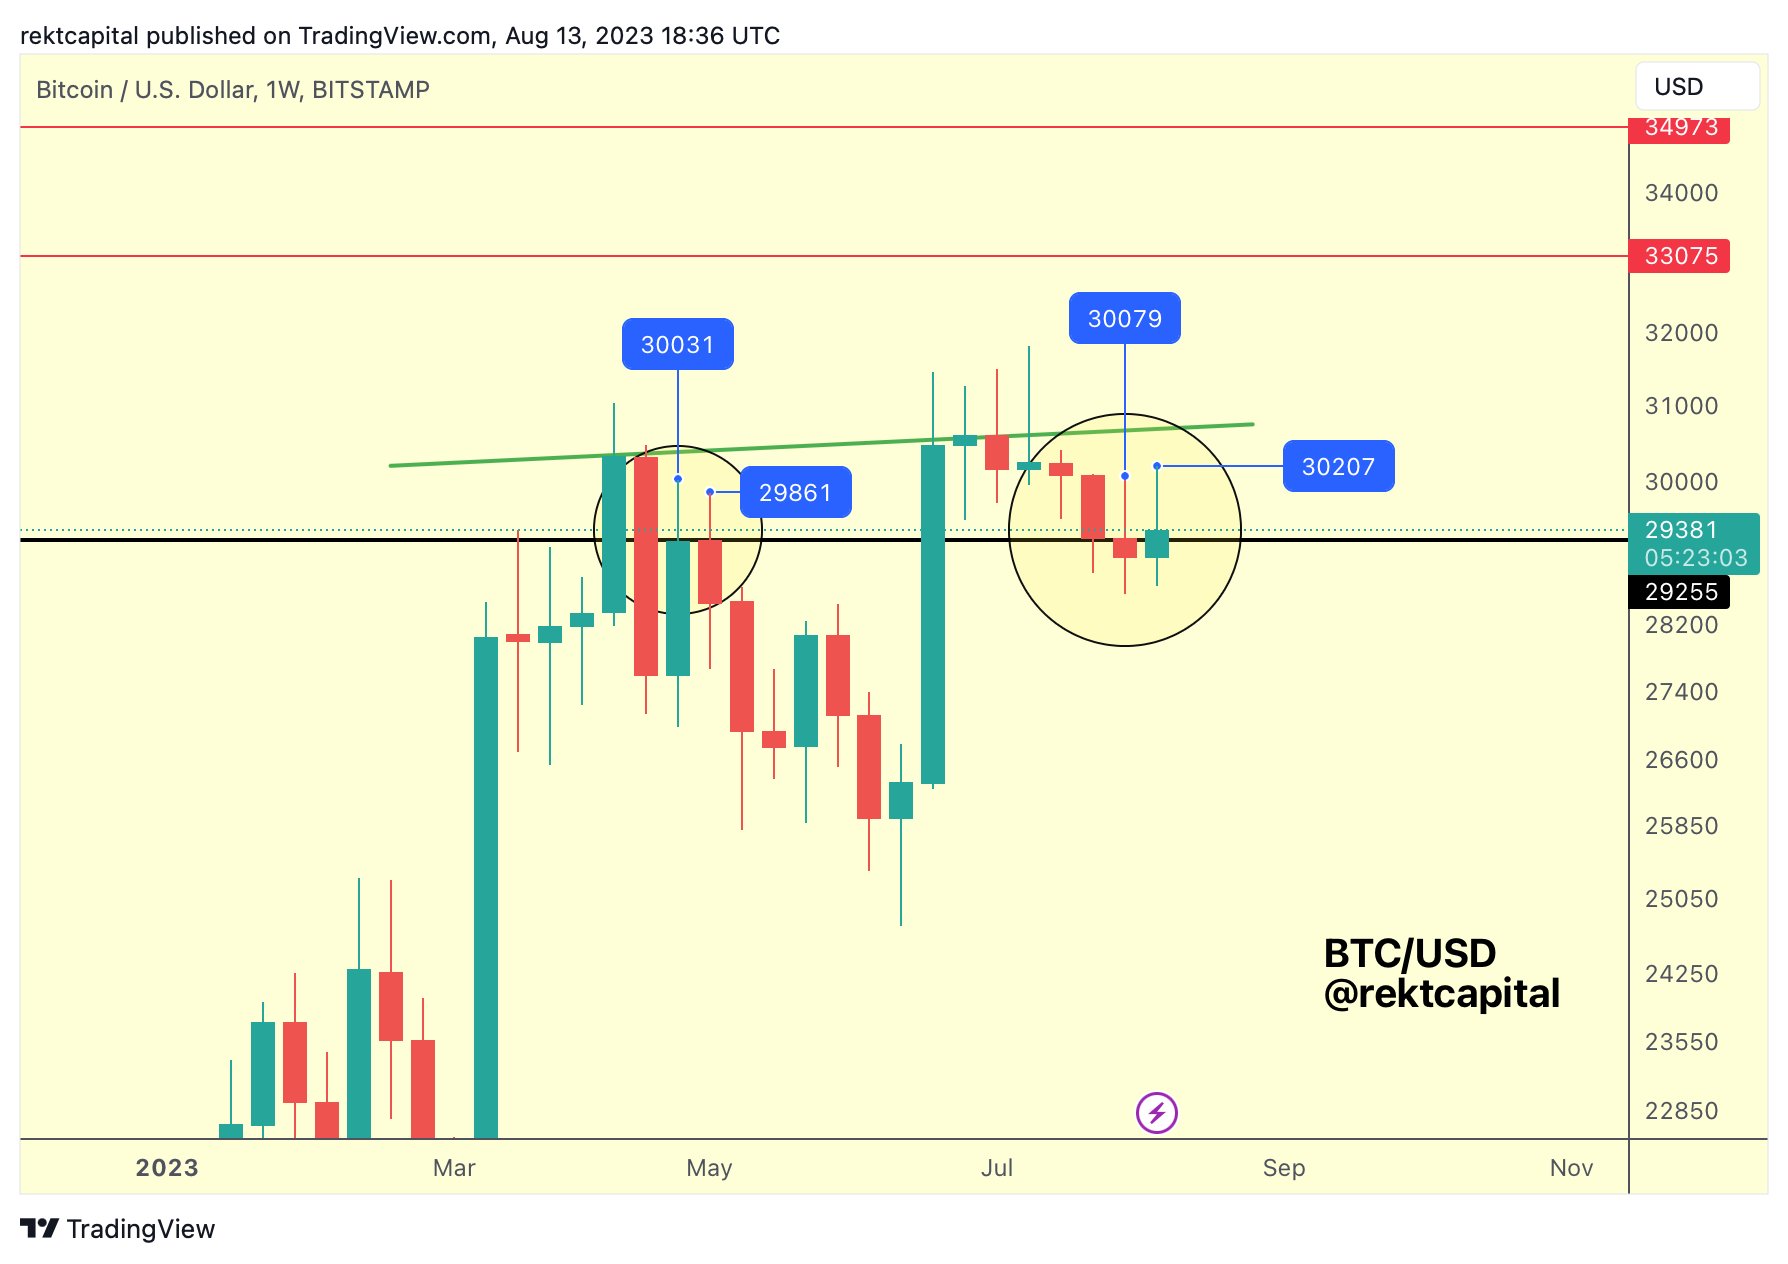
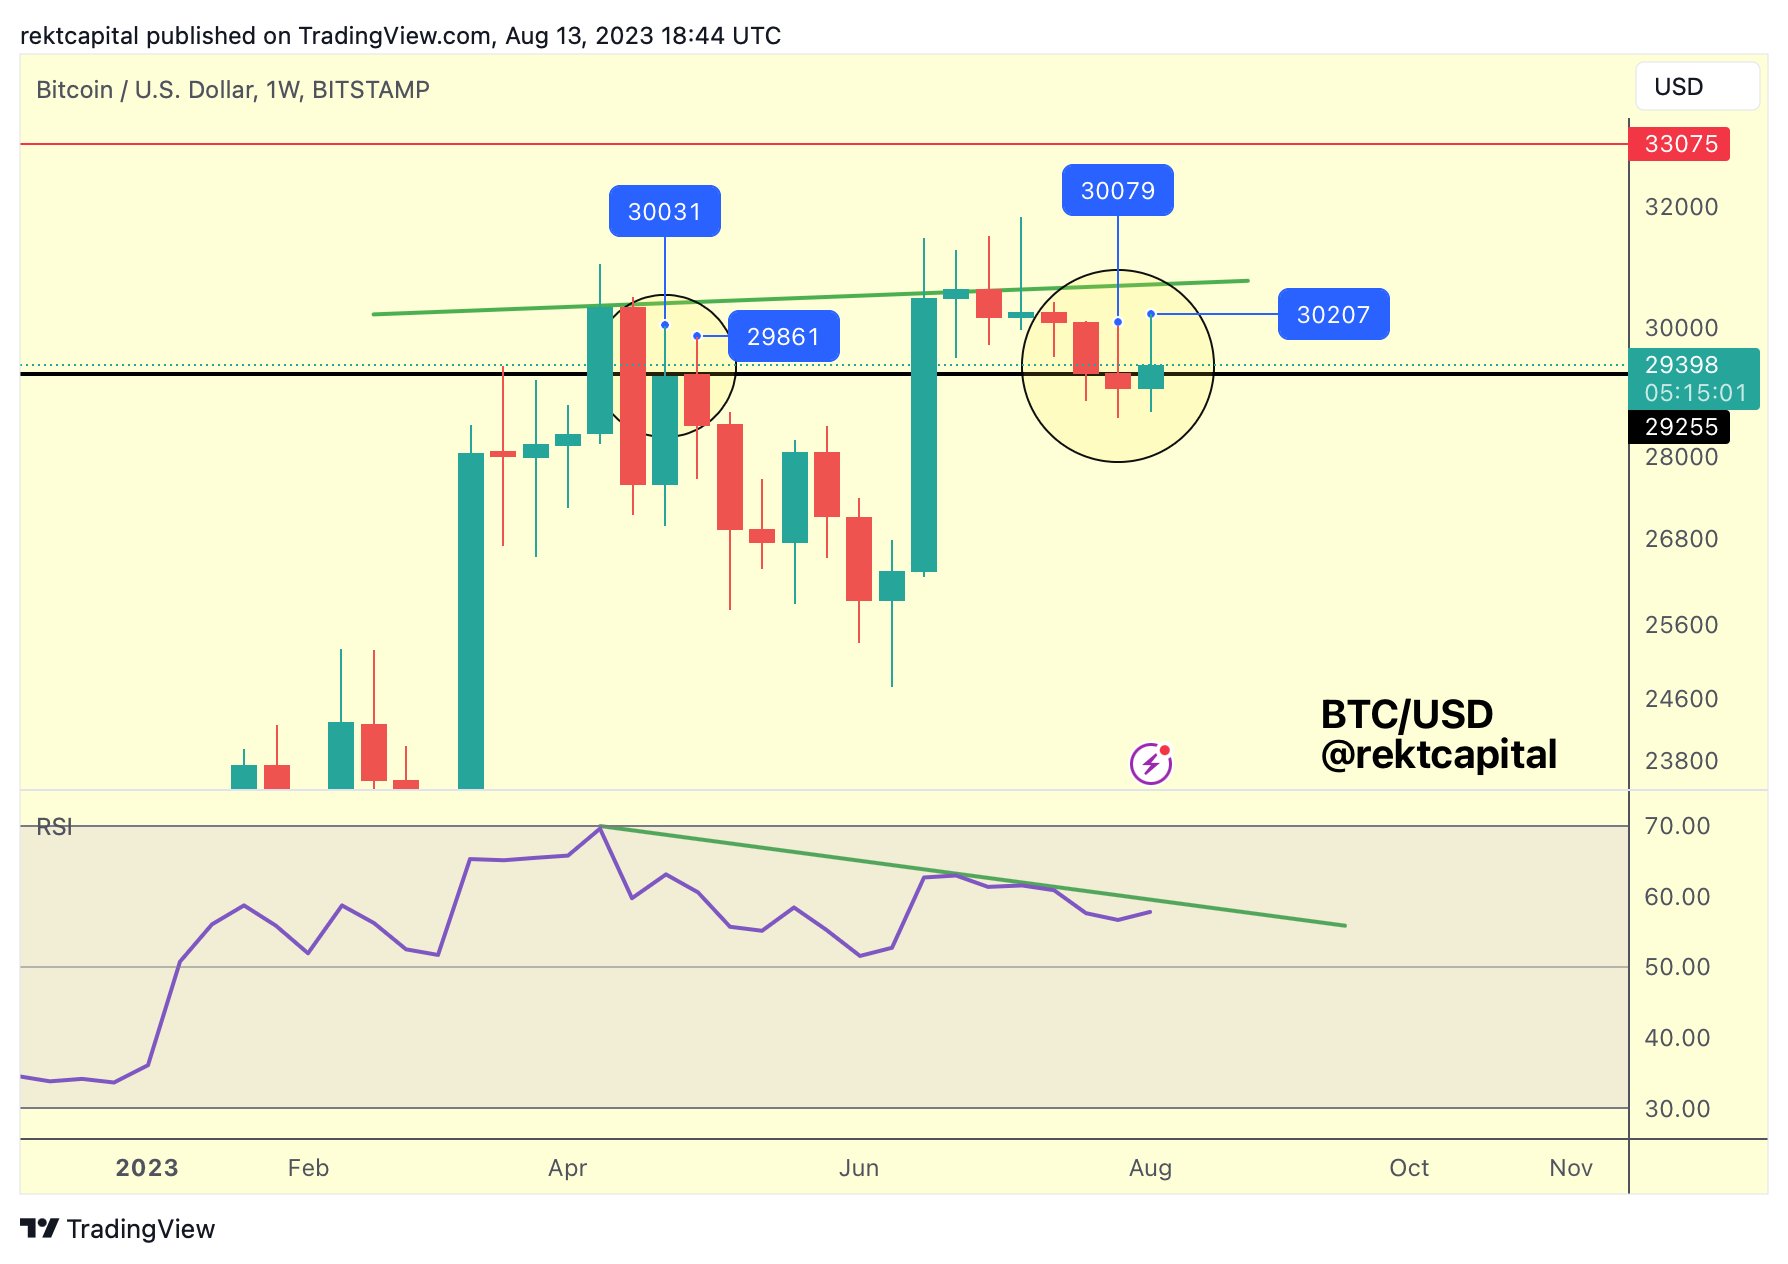
Bitcoin, by a hair, managed to close the weekly candle above $29,250 — a key level highlighted in recent weeks by popular trader and analyst, Rekt Capital.
In an X post just before the event, Rekt Capital referenced previous BTC price behavior after a close at $29,250 or higher.
“BTC upside wicked into the ~$30200 region, much like last week and in April 2023,” he noted.
“But if $BTC is able to Weekly Close above ~$29250, then that upside wick won’t be as bearish.”
Providing a potential headwind was relative strength index (RSI) data, which on 1-week timeframes continued to print a bearish divergence with price.
“Weekly Bearish Divergence for BTC will continue to remain intact unless the RSI is able to break its downtrend (green),” Rekt Capital commented about the phenomenon.
Historical data gives little clue as to how BTC/USD might behave before the monthly close.
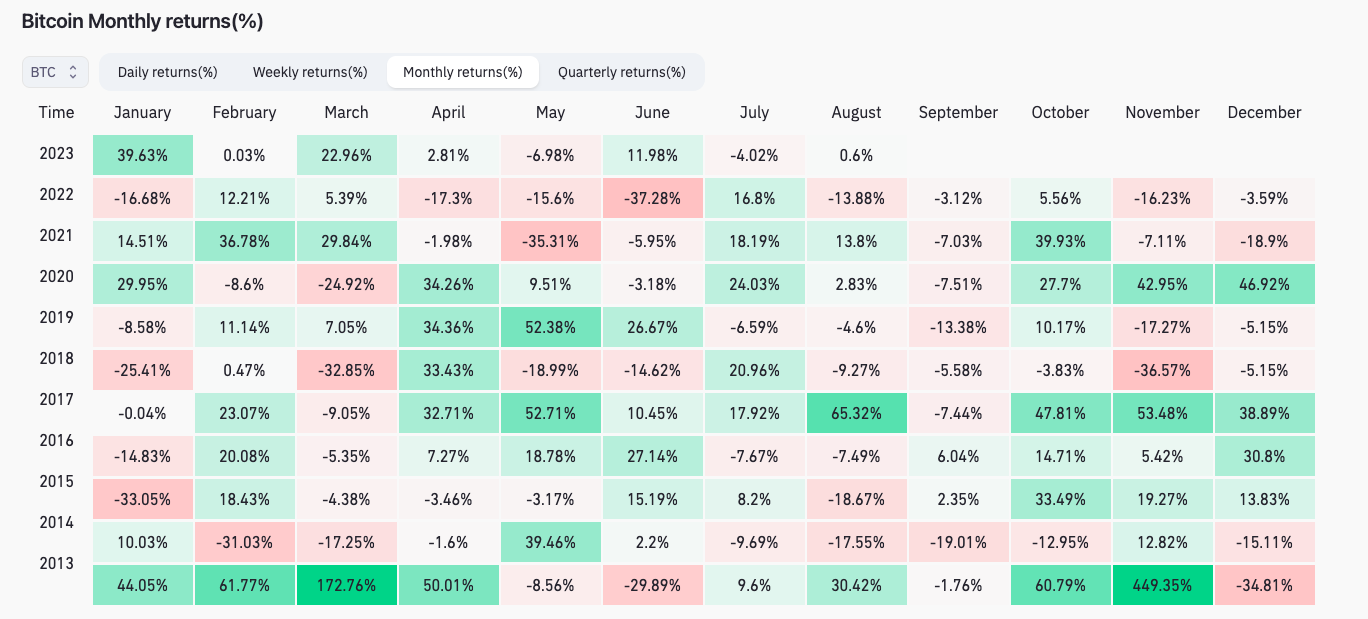
As Cointelegraph reported, August is a mixed bag when it comes to BTC price performance, and so far, Bitcoin has barely moved compared to the end of July.
Data from monitoring resource Coinglass shows that current gains of 0.6% mark Bitcoin’s quietest August month on record.
Low volatility spurs BTC price breakout predictions
It is hard to avoid the topic of volatility — or lack of it — when analyzing the current state of Bitcoin.
Despite heavy press coverage, even outside the crypto realm, the near total absence of snap price moves has been the defining characteristic of BTC price action for much of Q2.
The latest data lays bare just how static the landscape has become — and what should come afterward.
The Bitcoin Historical Volatility Index (BVOL) currently measures 9.57 on weekly timeframes, rapidly retracing to all-time lows from the start of this year.
What happened when Bitcoin broke out from a downtrend in January is no secret, with its Q1 upside totalling 70%.
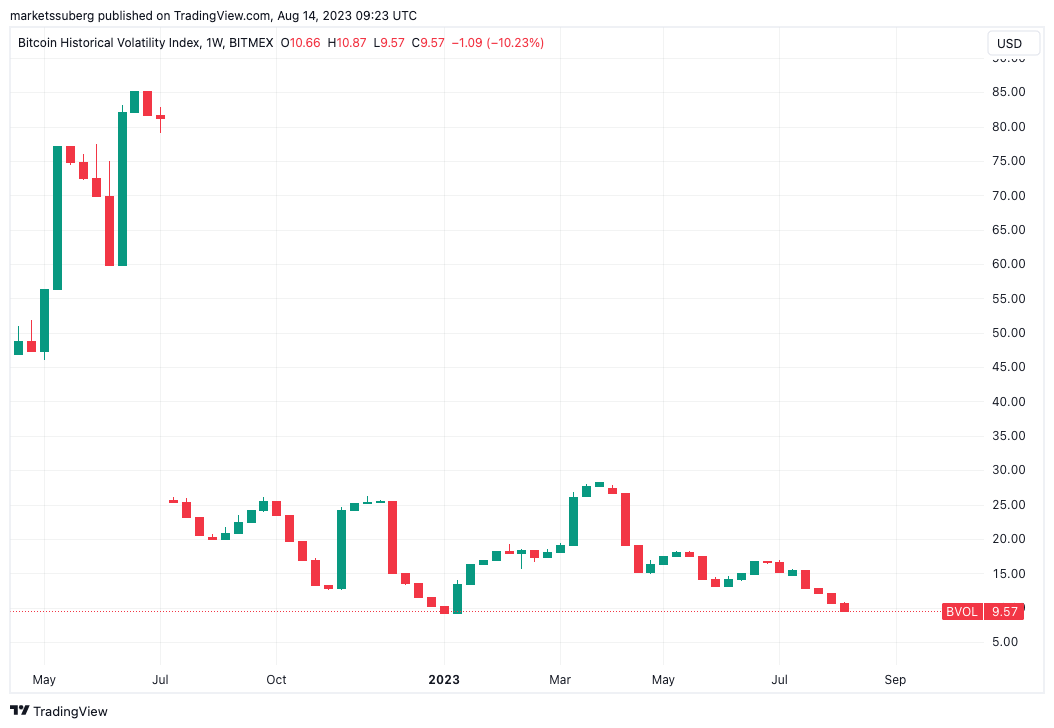
“The volatility on Bitcoin is getting lower and lower,” Van de Poppe thus stated.
“A matter of 1-2 weeks before we’ll be having a big move on the markets.”
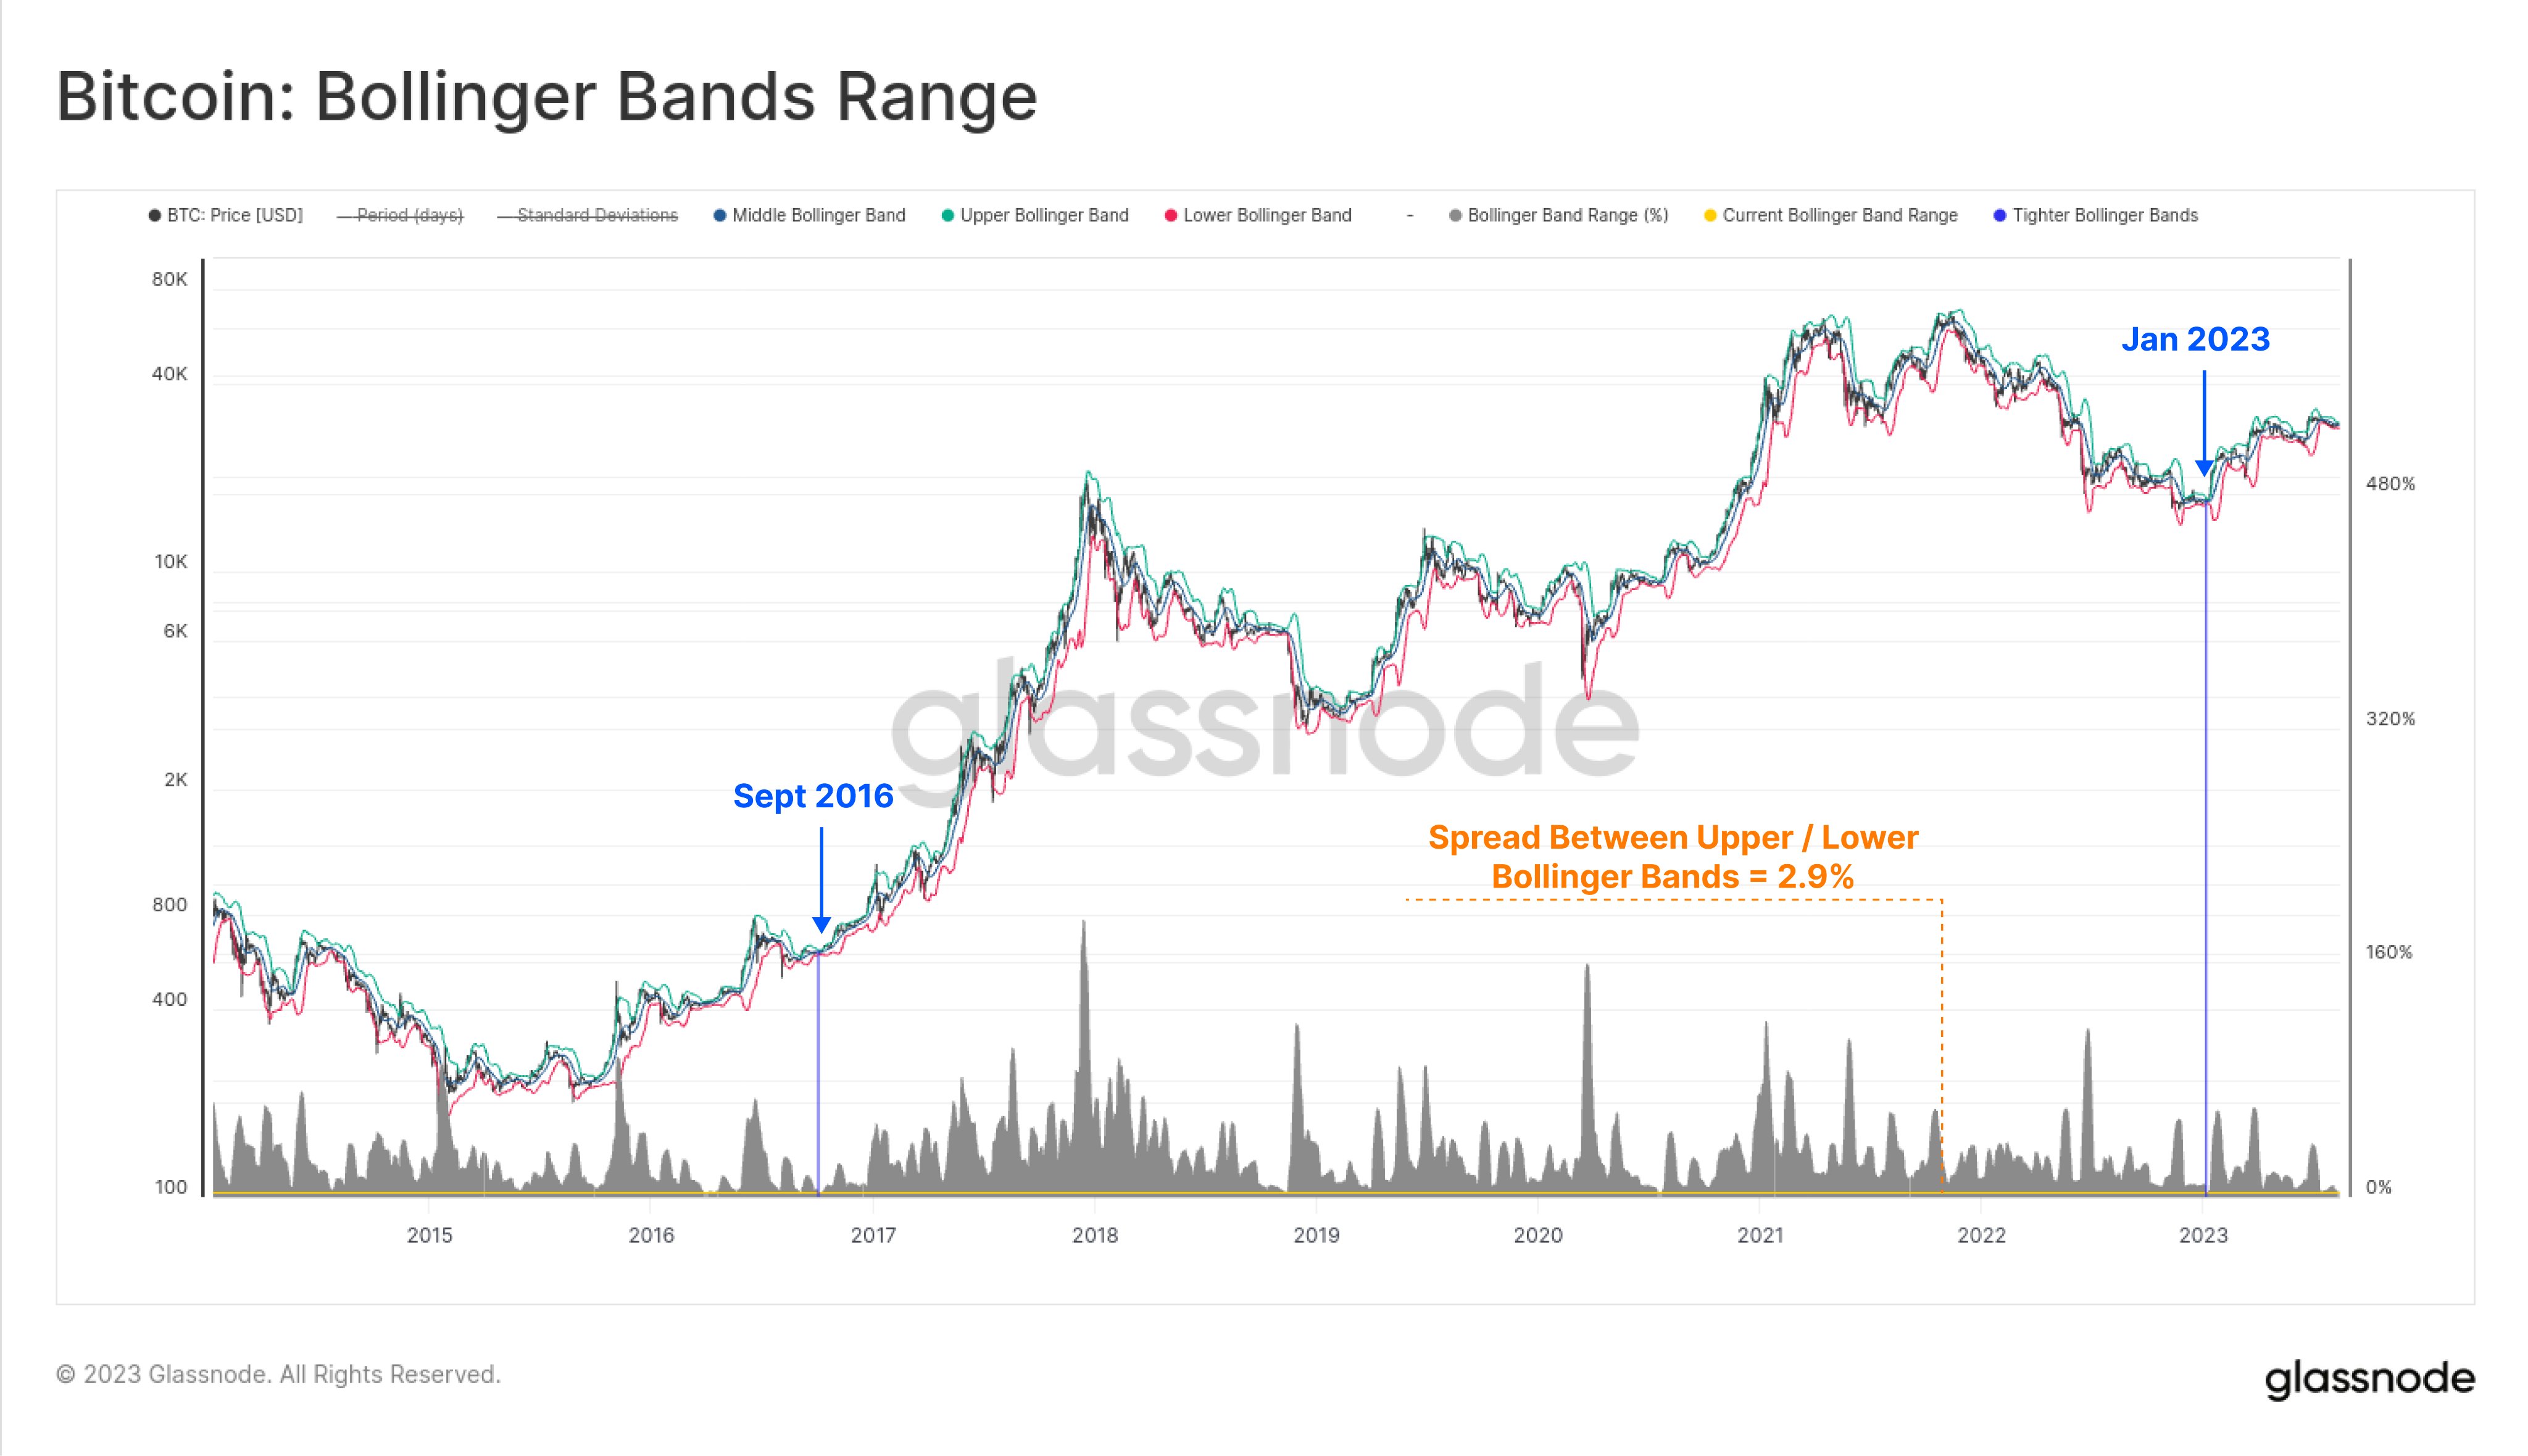
Similar findings come from the Bollinger bands volatility indicator, now also repeating behavior from the start of 2023.
Bollinger bands narrowing preclude a price breakout, and while unknown whether this would be up or down, the extent of price compression has market participants preparing for dramatic change.
“The spread between the Upper and Lower Bollinger Bands for Bitcoin is just 2.9% and is as tight as it has ever been,” Checkmate, lead on-chain analyst at Glassnode, wrote in part of an X post on Aug. 14.
Checkmate revealed that Bitcoin had printed tighter Bollinger bands just twice in its history — in September 2016 and January 2023.
“Wild stuff,” he concluded.
Whale “reaccumulation” narrative strengthens
Previously, Cointelegraph reported on interesting shifts among Bitcoin whales underneath stale BTC price action.
This is continuing, analysis shows, and what looks like accumulation is becoming an ever-larger talking point for those seeking signs of the bull market returning.
“In the past two weeks, about 10 Bitcoin whales, each holding at least 1,000 $BTC (worth a minimum of $29.4 million), have joined the network!” popular trader Ali noted at the weekend.
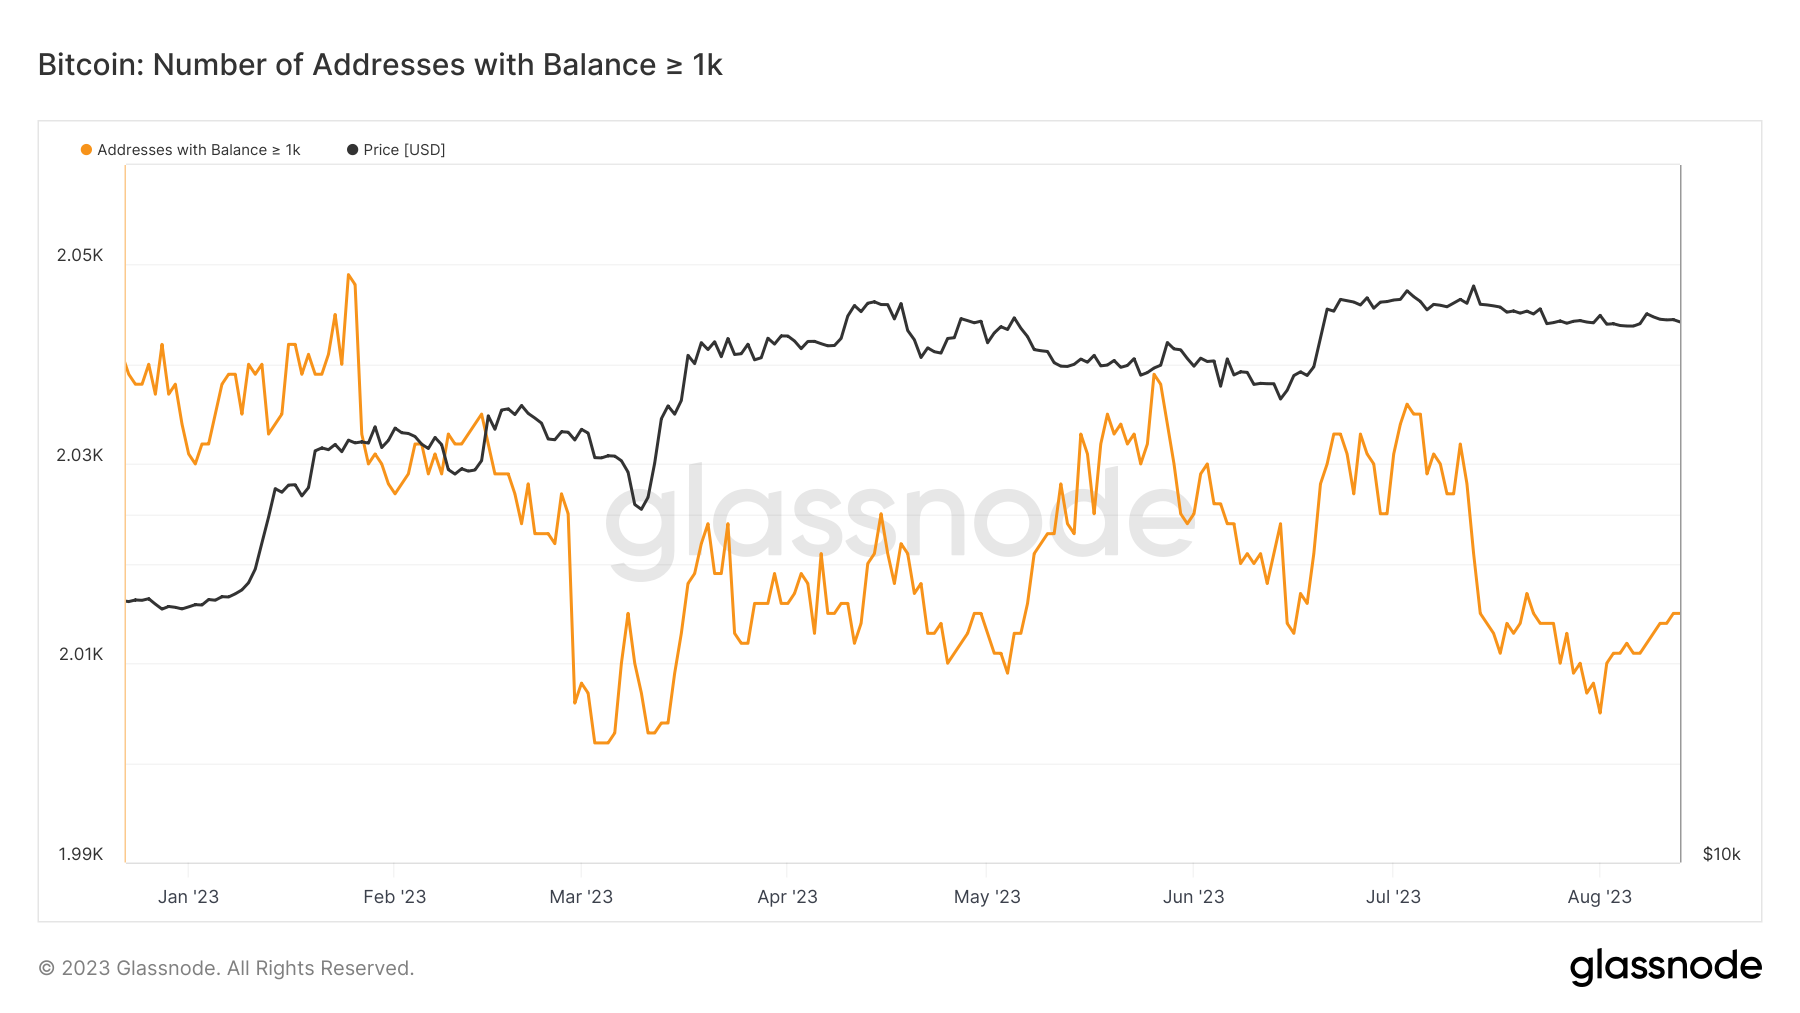
Glassnode data puts the total number of addresses with a balance of at least 1,000 BTC at 2,015 as of Aug. 13 — up from 2,005 on Aug. 1.
Maartunn, a contributor to on-chain analytics platform CryptoQuant, flagged the emergence of new whales on major exchange Bitfinex as proof that “something is brewing under the surface.”
And #Bitmex whales have joined the party. During the last night, I’ve got 3 notifications from massive new long positions
Something is brewing under the surface https://t.co/EFLYZCMFyV https://t.co/TDY0uEis6c pic.twitter.com/4Y29U8tTtj
— Maartunn (@JA_Maartun) August 13, 2023
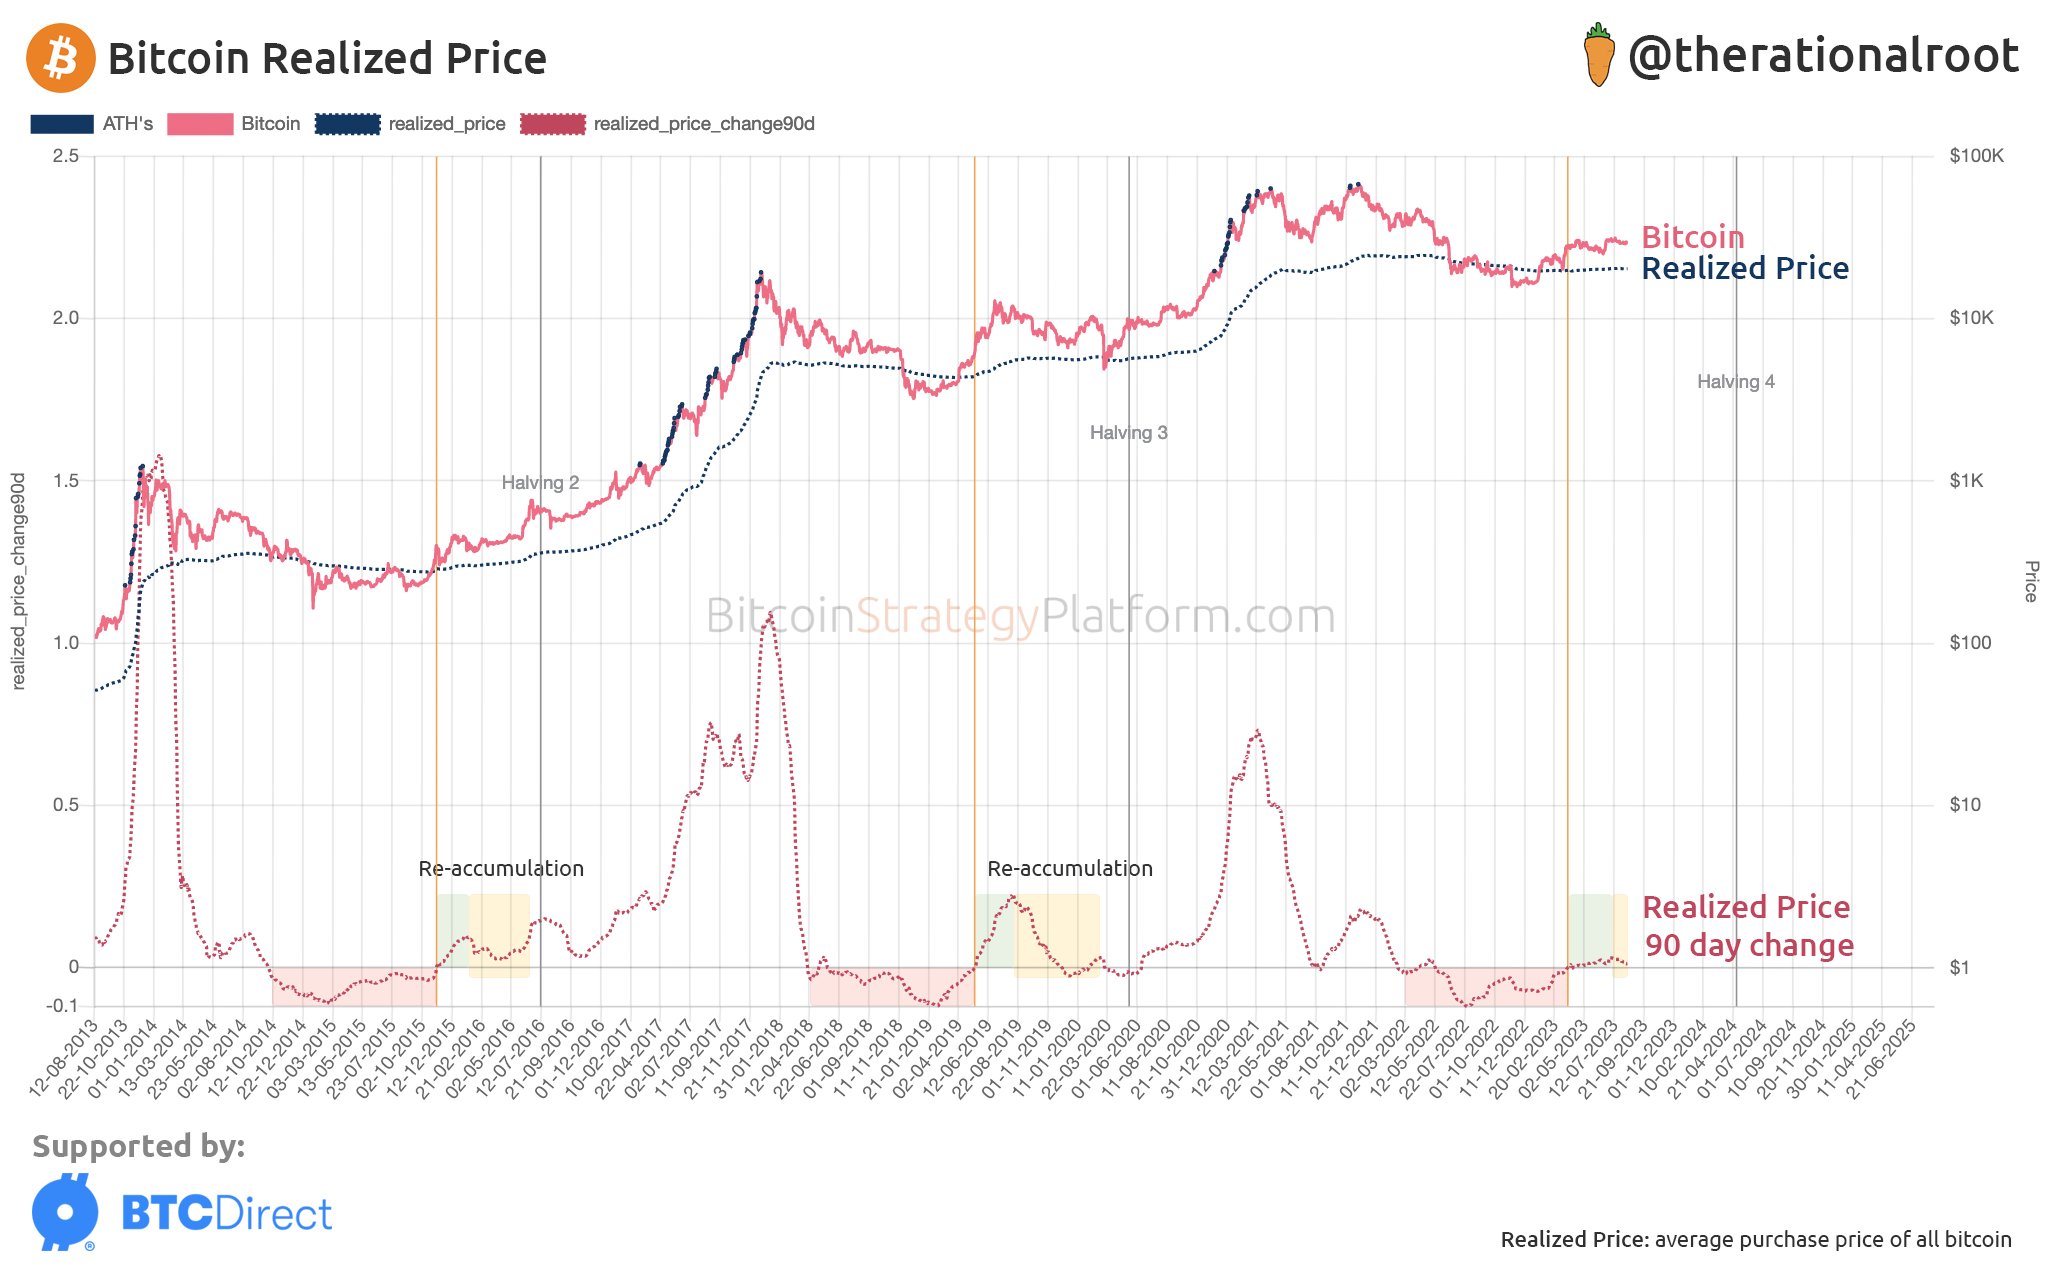
“Strong start off the cycle bottom, now in re-accumulation mode,” on-chain and cycle analyst Root continued, pointing to realized price figures.
Bitcoin’s realized price refers to the aggregate price at which the BTC supply last moved.
Fed FOMC minutes lead cool macro week
Crypto markets are in for a relatively quiet macroeconomic data period, in line with the summer lull.
Related: Bitcoin’s sideways price action leads traders to focus on SHIB, UNI, MKR and XDC
This week, while “big” for U.S. consumer data, has Federal Reserve minutes as its main highlight.
Key Events This Week:
1. July Retail Sales data – Tuesday
2. Building Permits data – Wednesday
3. Fed Meeting Minutes – Wednesday
4. Initial Jobless Claims – Thursday
5. Philly Fed PMI data – Thursday
6. Retail earnings including $WMT $TGT $HD
Big week for consumer data.
— The Kobeissi Letter (@KobeissiLetter) August 13, 2023
Those minutes will show the attitudes of Federal Open Market Committee (FOMC) members toward interest rate policy as they were when rates were hiked last month.
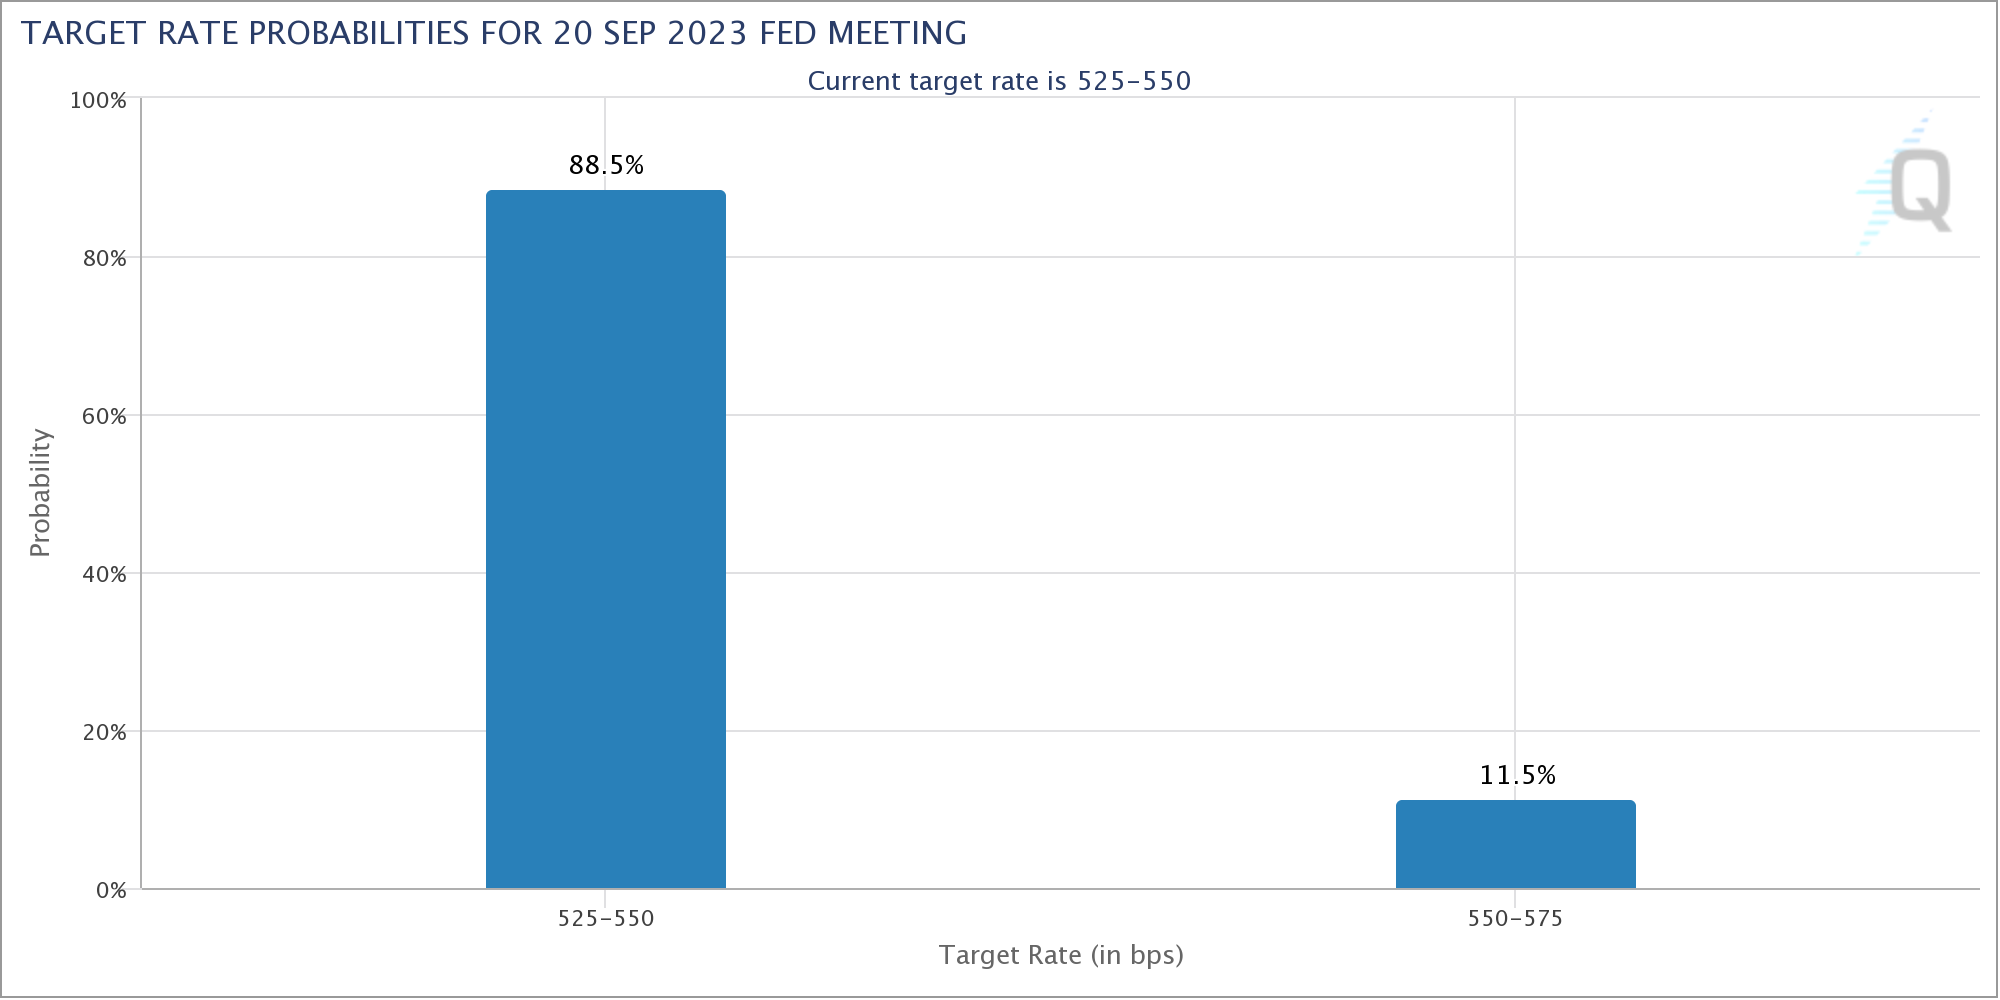
Risk asset traders continue to look toward the September FOMC meeting for a potential rate hike pause — something which should benefit crypto as well.
According to CME Group’s FedWatch Tool, the odds of that happening stand at almost 90%, with the meeting still over a month away.
Any knee-jerk BTC price reaction to this week’s data printouts, meanwhile, arguably looks unlikely — last week’s more significant releases failed to move markets.
Magazine: Deposit risk: What do crypto exchanges really do with your money?
This article does not contain investment advice or recommendations. Every investment and trading move involves risk, and readers should conduct their own research when making a decision.
Go to Source
Author: William Suberg


